Below described table is a production possibilities table for consumer goods (automobiles) and capital goods (forklifts):
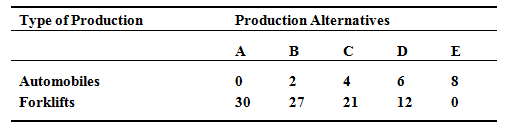
If the economy is at point C, describe the cost of one more automobile? Of one more forklift? Describe how the production possibilities curve reflects the law of rising opportunity costs.