Question:
Describe the differences between shifts in demand and movements along the demand curve. What are the main factors which can shift the demand curve? Explain why they cause the demand curve to shift. Use examples and draw graphs to support your discussion.
Answer:
Introduction
A demand curve represents all the combinations of price and quantity which are demanded by consumers in the market. It is typically negatively sloped for obvious economic reasons to be explored below (Friedman, 1949).
Various factors affect the demand curve. These may be price of the good, the availability of substitutes, consumers' preferences and many others. Among these factors, few lead to a change the position on the demand curve, and few lead to a shift in the demand curve; either to the left or to the right. The underlying mechanism in both these cases is quite interesting and, this is the subject of this essay.
The structure of the paper is as following. First, we discuss the demand curve and it basic features. Then we move on to the factor affecting demand, and hence, the demand curve. Then we move on to explaining the mechanism, and identifying the factors which lead to shift or movement along the demand curve. We keep on giving examples and supporting our claims through graphs and equations throughout. We conclude with the summarizing our findings, and giving some examples of the exceptions.
The Law of Demand and the Demand Curve:
Demand is governed by various factors. It is tough to characterize every factor into a single sentence. However, we have a powerful tool which helps us predict the nature of demand in almost every situation. We call it the Law of Demand (Marshall, 1895). Here we will demand two variants of law of demand, one which is bit narrower and the other which is comprehensive.
Definition 1: As the price of a good increase, the quantity demanded of that good decrease.
Definition 2: If the demand of a good decreases when income decreases, then the demand for that good must increase when its price decreases (Varian, 2003).
While the first definition is a general concept, the second definition is broader in the sense that it takes care of income and substitution effects, and also, it is adjusted for the perverse cases like inferior goods and Giffen goods.
Now, as the definition shows, the demand curve will be downwards sloping, if we plot price on the vertical axis and quantity demanded on the horizontal axis. This is illustrated below in figure one.
This is a typical demand curve. A movement from a to b represents that the price decreases from P1 to P2. This will lead to, according to Law of Demand, an increase in quantity demanded from Q1 to Q2. This illustrates exactly why the demand curve is negatively sloped.
Factors affecting demand:
As mentioned above, there are a number of factors which affect the quantity demanded. In general, any factor which affects the purchasing power and preferences of a consumer will affect the demand. This change, in turn, will lead to either a shift or a movement along the demand curve. Here is a list of few factors which affect demand (Samuelson, 1964):
(i) The price of the good
(ii) Price of related goods, like substitutes and complements
(iii) Income of the consumer
(iv) Wealth of the consumer
(v) Consumer preferences
(vi) State of the economy
(vii) Future expectations about the income, wealth or state o the economy, etc.
(viii) Tastes
Shifts and Movements along the demand curve:
There are two standard variations related to the demand curve: one is the movement along the demand curve, and the other one is the shift in the demand curve. These two are illustrated below. The change of position on demand curve from A to B is an example of movement along the demand curve. The change of the position of demand curve from D to D' is an example of rightwards shift of the demand curve.
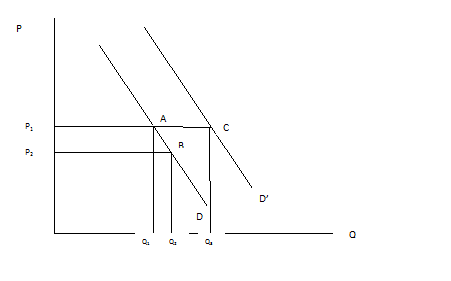
As we see from the figure above, a movement from A to B represents that there has been a change in the price. A change in price leads to a change in quantity demanded, according to the Law of Demand. Here, there is a decrease in price; therefore, the quantity demanded increases. Thus, a movement along the demand curve represents a change in prices, given everything else remaining constant.
A shift of the demand curve from D to D', on the other hand, represents a different picture. At the price level P1, there is an increase in demand from Q1 to Q3. This means that everything else remaining constant, the purchasing power of the consumer has increased. This may be caused by an increase in income, a sudden inheritance, or other factors to be discussed below. Note that price of the good has nothing to do with the shift in the demand curve.
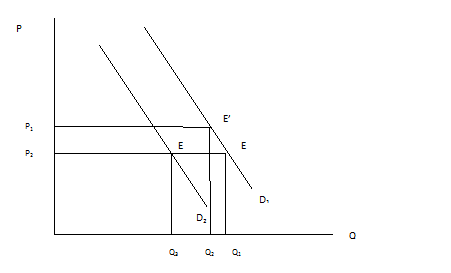
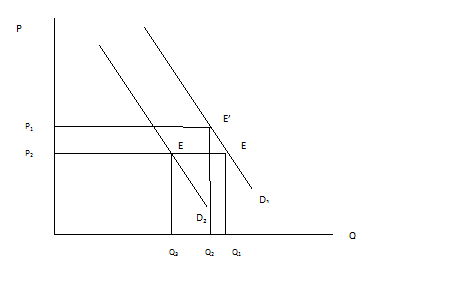
We illustrate this difference with a day-to-day example. Suppose I am an avid book reader. I especially like books which are related to the study of the universe. Now, someday I go to the bookstore and find that the price of the books has increased. Given my monthly pocket money, I will fewer books, as my purchasing power has decreased, and I have other things to do with that money. This will, thus, represent a point to the left of my initial demand point E.
On the other hand, suppose, that the price of remains constant. But, my pocket money is reduced. This means that my purchasing power all over all goods is decreased, including books. Therefore, without any change in the price of the books, my demand for books will decrease. I will buy fewer books now. The catch is at all price levels. This will lead to a shift in the demand curve to the left, as shown below by a shift from D1 to D2.
Therefore, while the movement along the demand curve is governed by the law of demand, the shift in the demand curve is caused by external factors. These external factors are anything other than the change in prices. Here are a few factors and how they lead to a shift in the demand curve:
(i) Price of related goods, like substitutes and complements: If there is an increase in the price of one of the substitutes, the demand for the good under consideration will increase. On the other hand, an increase in price of a complement good will shifts the demand curve to the left.
(ii) Income of the consumer: An increase in income increases the purchasing power at all level of prices, and hence the demand curve will shift to the right.
(iii) Wealth of the consumer: Unlike income, wealth is stock variable. However, it also affects the demand in the same way as income.
(iv) Consumer preferences: Suppose due to some advertisement, or through reading on internet, I realize that I should read books on economics, rather than the fiction books. This means my preferences shift away from fiction books, even when the prices are constant. This will lead to a shift in the demand curve of fiction books to the left.
(v) State of the economy: Suppose the economists predict that the economy is facing prospects of a downturn. This implies that the future flows of my income are not that assured. This makes me save more and spend less. All this happens while the price of video games is constant. This will shift my demand curve for video games to the left.
(vi) Tastes: I like strawberry flavored ice cream. But someday I try the chocolate flavor, and realize that it is better. This means my tastes for ice cream has changed. So there is a change in the demand for chocolate ice cream, at the given prices. So the demand for chocolate ice creams will shift to the right.
Thus, there are a whole lot of factors which tend to affect the demand for a good. Anything which changes the demand while the prices are constant tends to shift the demand curve. The reason is that the demand curve is a plotting of price and quantity demanded. In case of changes in quantity demanded, without there being a change in prices, lead to a change in quantity demanded at all price levels, which in turn, generates a parallel demand curve either to the left or right of the earlier demand curve.
Conclusion:
There are two basic changes in the demand schedule which come from various factors: these are namely the shift in the demand curve and the movement along the demand curve. The movement along the demand curve is governed by the Law of Demand, that is. If the price increases then the quantity increases and hence, there be a leftwards movement along the demand curve. On the other hands, any factor affecting demand barring price of the good, will lead to a shift in the demand curve. These factors may change in income, change in taste, change in preferences, change in prices of substitutes and complement goods, change in expectations about the future of the economy, etc.
However, there are certain goods which do not follow the law of demand. For these goods, the increase in prices leads to an increase in demand. Therefore the demand curve of these goods is upward sloping rather than downwards sloping. These are a class of good called Giffen goods (Nachbar, 1988). Also, there are goods for which an increase in income leads to a decline in the demand for these goods. These goods are called inferior goods (Hicks 1959) (Garratt, 1997).
Apart from these perverse cases, the law of demand is well defined, and our analysis holds in general for most of the commodities.