Consider the total demand for wheat and the net supply of wheat per month in the Kansas City grain market are depicted following:
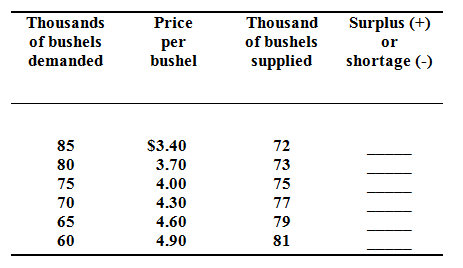
Graph the demand for wheat & the supply of wheat. Ensure to label the axes of your graph correctly. Label equilibrium price P and the equilibrium quantity Q.