--%>

Kinked Demand by decreasing price

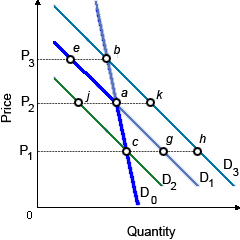
In this kinked demand curve model as in given graph, when this firm operated at point a and lowered its price by P2 to P1 and other firms in the industry also lower prices, in that case this firm will move from point a to: (w) point g.  (x) point c. (y) point h. (z) point j.

212_Kinked Demand Curves.png

Please choose the right answer from above...I want your suggestion for the same.

   Related Questions in Microeconomics

  • Q : Transfer payments in Market Transfer

    Transfer payments into the U.S.: (w) have little effect on income distribution. (x) are mainly received by wealthy families. (y) tend to reduce poverty. (z) eliminate the cause of poverty. Please choose the right a

  • Q : Pure competition market A purely

    A purely competitive market would NOT be illustrated by: (1) many potential buyers and sellers. (2) each buyer or seller being a price taker. (3) an absence of long-run barriers to entry or exit. (4) aggressive advertising to compare brands. (5) a sin

  • Q : Competitive equilibrium in competitive

    I have a problem in economics on Competitive equilibrium in competitive labor markets. Please help me in the following question. The Competitive equilibrium in competitive labor markets need: (1) P = MR = AVC. (2) VMP - P is maximized. (3) MPP = P. (4

  • Q : Transactions increment and moves in

    Transactions increase and demand prices move below supply prices while a good turns into: (w) subsidized by the government. (x) subject to a high sales tax. (y) more technologically advanced. (z) a complementary by pr

  • Q : Minor Inefficiencies in Monopolistic

    Minor inefficiencies generated since monopolistic competitors differentiate their products may be more than offset through the: (w) increase in economic equity. (x) expansion of the psychologically-meaningful choices obtainable to consumers. (y) reduc

  • Q : Equal distributions of income or wealth

    Perfectly equal distributions of income or wealth are reflected within the Lorenz curve demonstrated as: (i) line 0A0'. (ii) line 0B0'. (iii) line 0C0'. (iv) line 0D0'. (v) line 0E0'.

    Q : Increasing cost industries in long run

    When cranberry farming is an increasing constant cost industry and that firm is typical, in that case an increase within the market demand for cranberries will give in a long run equilibrium price as: (i) less than P1. (ii) greater than P2.

  • Q : Income Distribution and Satisfaction

    The proposition which taxing the rich to provide to the poor improves social welfare can’t be proved due to the impossibility of: (1) developing a political consensus about efficient redistribution programs. (2) the marginal utility of income di

  • Q : Unitarily price elasticity demand for

    When milk prices increase from $2 to $3 per gallon and sales fall by 600,000 gallons to 400,000 gallons monthly, then demand for milk is: (w) relatively price elastic. (x) unitarily price elasticity. (y) a 45 degree, negatively sloped

  • Q : Wealth distribution by income When line

    When line 0C0' shows the 2005 U.S. income distribution, in that case the line that would shows the 2005 wealth distribution would be probably line: (1) line 0A0'. (2) line 0B0'. (3) line 0C0'. (4) line 0D0'. (5) line 0E0'.