--%>

Investment based question

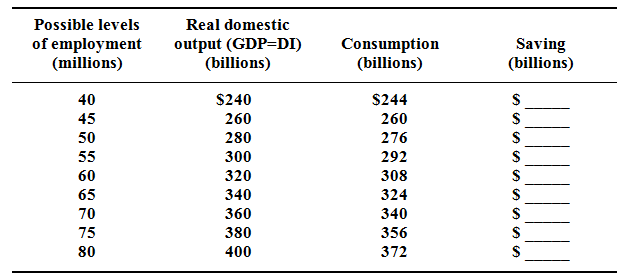
Utilizing the consumption and saving data in given table and supposing investment is $16 billion, describe saving and planned investment at the $380 billion level of domestic output? Determine saving & actual investment at that level? Determine saving and planned investment at the $300 billion level of domestic output? Describe levels of saving & actual investment? Employ the concept of unplanned investment to describe adjustments toward equilibrium through both the $380 and $300 billion levels of domestic output.

1939_consumption and saving data table.png

E

Expert

Verified

At the $380 billion level of GDP, saving is $24 billion; planned investment will be $16 billion (from the question). This deficiency of $8 billion of planned investment causes an unplanned $8 billion rise in inventories.  Actual investment is $24 billion (= $16 billion of planned investment as well as $8 billion of unplanned inventory investment), matching the $24 billion of actual saving.

    At the $300 billion level of GDP, saving is $8 billion; planned investment wills $16 billion (from the question). This excess of $8 billion of planned investment causes an unplanned $8 billion decline in inventories. Actual investment is $8 billion (= $16 billion of planned investment minus $8 billion of unplanned inventory disinvestment) matching the actual of $8 billion.

   While unplanned investments in inventories takes place, as at the $380 billion level of GDP, businesses revise their production plans downward and GDP drop. While unplanned disinvestments in inventories take place, as at the $300 billion level of GDP; businesses revise their production plans upward and GDP increase.  Equilibrium GDP—in this case, $340 billion—takes place where planned


   Related Questions in Finance Basics

  • Q : Change in GDP Normal 0 false false

    Normal 0 false false

  • Q : Question on aggregate supply Normal 0

    Normal 0 false false

  • Q : Describe the risk-return relationship

    Describe the risk-return relationship.The relationship among risk and required rate of return is term as the risk–return relationship.  This is a positive relationship since the more risk assumed, the higher the required rate of retur

  • Q : Alternative combinations of the two

    Assume you won $15 on a Lotto Canada ticket at the local 7-Eleven & decided to spend all the winnings on bags of peanuts and candy bars. The cost of candy bars is $.75 and the cost of peanuts is $1.50. Build a table illustrating the alternative combinatio

  • Q : What is FERA FERA stands for The

    FERA stands for The Federal Emergency Relief Administration. The program was renamed as a direct relief operation in Roosevelt Administration. It was a form of an unemployment insurance.

  • Q : Effect of merger activity in the

    How has the merger activity in the past decade influenced the concentration of assets in the banking industry? Over the last decade, the number of commercial banks declined through twenty-one percent and the averag

  • Q : What is Make-Buy Analysis Make-Buy

    Make-Buy Analysis: Business decision which compares the costs and advantages of manufacturing a product or product component alongside purchasing it. When the purchase price is high than what it would cost the manufacturer to prepare it, or when the m

  • Q : Generalization Normal 0 false false

    Normal 0 false false

  • Q : Explain Statewide Cost Allocation Plan

    Statewide Cost Allocation Plan (SWCAP): It is the amount of state administrative, General Fund costs (example, amounts expended by the central service departments like the State Personnel Board, State Treasurer’s Office, State C

  • Q : Explain compound interest Normal 0

    Normal 0 false false