--%>

Inelastic proportion of demand in monopolistic competition

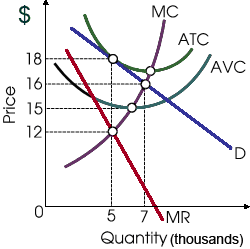
This profit-maximizing firm in illustrated graph will never knowingly generate: (w) where MR is positive. (x) where MR is falling. (y) on the elastic proportion of the demand curve. (z) on the inelastic proportion of the demand curve.

1522_Monopolistic Competition1.png

Hello guys I want your advice. Please recommend some views for above Economics problems.

   Related Questions in Microeconomics

  • Q : Formula for primary deficit What is the

    What is the formula for primary deficit? Answer: Primary deficit = fiscal deficit – interest payment.

  • Q : Marginal Utility-Consuming extra unit

    The satisfaction gained from consuming an additional unit of the good is: (1) Always diminishing. (2) Its marginal utility. (3) Objectively measurable. (4) Equivalent to one util. Choose the right answer from the above options.

  • Q : Describe price elasticity of demand

    Price elasticity of demand: The Price elasticity of demand refers to the degree of responsiveness of the quantity demanded to modifications in price. Ed = (ΔQ/Δ P) x (P/Q)

  • Q : Output From the heterodox approach,

    From the heterodox approach, what options does the enterprise need to produce more output? What effect do these options put on its cost structure?

  • Q : Help For a monopsonist in the labor

    For a monopsonist in the labor market, the marginal resource cost of labor is:

  • Q : Marginal social costs exceed the

    When governments compelled pharmaceutical producers to manufacture and sell at least Q3 penicillin, in that case the: (1) purely-competitive firms which produced penicillin would experience persistent economic profits. (2) resulting inadequate antibiotic tr

  • Q : Determine total revenue by zero

    Hybrid Roses is the merely florist in 60 miles of Presidio, Texas. Often, lots of Texans are romantics at heart. When Hybrid Roses set the price of a dozen roses at the point where marginal revenue is zero, in that case its total revenue

  • Q : Managerial economics and good business

    please find the attached file (project) and qoute for it. minimus 7 pages required.

  • Q : Area of Loren Curve This function as in

    This function as in illustrated figure area between A and B is termed as a/an: (1) index of inequality. (2) Lorenz curve. (3) Pareto indicator. (4) Gini coefficient. (5) Marx-Engels curve.

    Q : Similarity of elasticities of demand

    When a price hike for regular gas from $2.00 to $2.20 reduces quantity demanded from 20 million gallons to 19 million gallons daily, and an raise in the price of premium gas from $3.00 to $3.20 decreases its quantity demanded daily from 20 million gal