--%>

Individual demand and market demand schedules

Individual demand and market demand schedules:

Individual demand schedule states the quantities required by an individual consumer at various prices.

Table: Individual demand schedule for oranges

2370_market demand schedules1.jpg

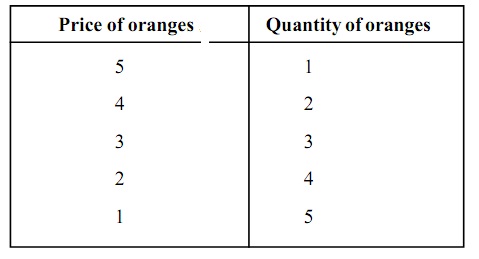
 It is apparent from the schedule that whenever the price of orange is $ 5/- the consumer demands simply one orange. Whenever the price falls to $ 4 he demands for 2 oranges. Whenever the price falls further to $ 3, he demands for 3 oranges. Therefore, whenever the price of a commodity falls, the demand for that commodity rises and vice-versa.

Market demand schedule:

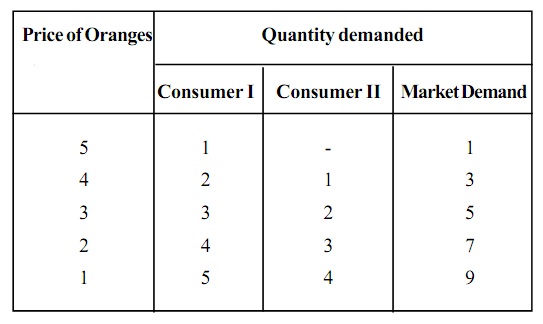
A demand schedule for a market can be build by adding up demand schedules of the individual consumers in the market. Assume that the market for oranges comprises of 2 consumers. The market demand is computed as follows.

Table: Demand Schedule for two consumers and the Market Demand Schedule

505_market demand scheduless2.jpg

   Related Questions in Microeconomics

  • Q : Relatively market power The firm from

    The firm from the given list with relatively the most market power would probably be: (w) General Motors. (x) the world's biggest wheat farm. (y) a gas station in Wayout, Wyoming that has no competitors into 70 miles. (z) the BestBuy in Durham, North

  • Q : More willing to hold less cash and more

    When households become more willing to hold less cash and more stocks or bonds, in that case the: (1) level of Aggregate Demand increases. (2) present value of future income falls. (3) interest rate falls. (4) stock market will crash.

  • Q : Introduction of marginal utility The

    The marginal utility (MU) of a good: (1) Was first introduced by Adam Smith. (2) Is simply measured in dollars. (3) Is determined by society as an entire. (4) Reflects subjective preferences. Can someone help me in getting through

  • Q : Labor Contracts of Check-off Provisions

    When a collective bargaining contract comprises a ‘check-off provision’: (1) Union workers can be fired when they don’t meet the production quotas. (2) Firms gather the union dues through deducting them from the paychecks. (3) Workers are needed to d

  • Q : Profit-maximizing lumber on the average

    On the average, that profit-maximizing lumber mill as in demonstrated graph is: (w) making an economic profit of regarding $0.20 (20¢) per 2×4. (x) incurring variable costs of $0.90 (90¢) per 2×4. (y) suffering an accounting loss

  • Q : Problem on Hicks model of collective

    The model of collective bargaining designed by the John Hicks graphically resolves for the level of: (i) Wage rate and length of strike. (ii) Fringe advantages and safety cases on the job. (iii) Wage rates and union dues. (iv) Union control over the w

  • Q : Illustration of Distribution of Income

    An illustration of distribution of income in accord along with the contribution standard occurs while: (1) the federal government relies on a very progressive income tax for most of its revenue. (2) production is produced, “from each, according

  • Q : Determine market demand in curve The

    The market demand curve as in demonstrated figure for Christmas trees is: (i) curve A. (ii) curve E. (iii) curve F. (iv) curve G. (v) curve J.

    Q : Importance of strategic management

    Explain in brief about the importance of strategic management towards the success of a business?

  • Q : Please In the quintile distribution of

    In the quintile distribution of income, the term "quintile" represents: A 5 percent of the income receivers. B 10 percent of the income receivers. C 15 percent of the income receivers. D 20 percent of the income receivers.