Increasing supply problem
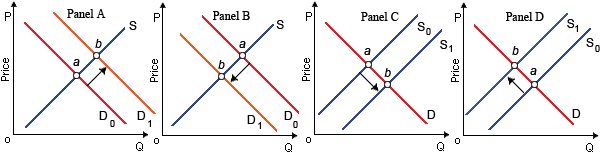
Whenever the equilibrium in the figure shown move from point a to point b, raised supply has taken only in the market illustrated in: (i) Panel A. (ii) Panel B. (iii) Panel C. (iv) Panel D. Please someone suggest me the right answer.
Whenever the equilibrium in the figure shown move from point a to point b, raised supply has taken only in the market illustrated in: (i) Panel A. (ii) Panel B. (iii) Panel C. (iv) Panel D.
Please someone suggest me the right answer.
The reduction in demand accompanies all of the following apart from: (i) Expectations of better accessibility or excesses. (ii) Declines in the price of substitute. (iii) Rises in the number of buyers. (iv) Negative modifications in preferences and ta
distinguish between full employment and under employment
A family which has income greater than half the median incomes of other American families, although less than twice which median income, is categorized by the Department of the Census as: (1) impoverished. (2) low relative income. (3) working class. (
Wal-Mart business practices have been criticized like destroying small town America. Therefore argument is that Wal-Mart will build a new store and firstly set prices so low that they ultimately drive off all rival businesses. As per its foes, after their rivals move
Evidence that may potentially be cited as conflicting with the law of diminishing marginal utility would comprise: (i) Della’s enthusiasm for all-you-can-eat buffet diminishes subsequent to her fifth plate of lasagna. (ii) Jethro trades in his 1981 Gremlin on th
Can someone help me in finding out the right answer from the given options. All the profit maximizing firms use labor up to the point where: (1) VMP = MFC. (2) VMP = w. (3) VMP = MRP. (4) MRP = MFC. (5) MR MC is maximized.
Transfer payments and progressive tax policies are being determinate to: (w) reduce disparities in the distributions of income and wealth. (x) shift the Lorenz curve toward a position of less income equality. (y) have no net effect on income equality
When this monopolistic competitor makes Q units: (1) P > MC. (2) MR = MC. (3) total revenue total cost is maximized. (4) MSB > MSC. (5) All of the above. Q : Illustrates average variable cost curve LoCalLoCarbo has become the favorite of fad dieters. There in curve E shows: (1) LoCalLoCarbo’s marginal cost curve. (2) LoCalLoCarbo’s average variable cost curve. (3) LoCalLoCarbo’s average total cost curve. (4) the market demand curve facing LoCal
LoCalLoCarbo has become the favorite of fad dieters. There in curve E shows: (1) LoCalLoCarbo’s marginal cost curve. (2) LoCalLoCarbo’s average variable cost curve. (3) LoCalLoCarbo’s average total cost curve. (4) the market demand curve facing LoCal
What is APS? APS = S/Y.It is the ratio of income to saving which is termed as APS.
18,76,764
1946448 Asked
3,689
Active Tutors
1433278
Questions Answered
Start Excelling in your courses, Ask an Expert and get answers for your homework and assignments!!