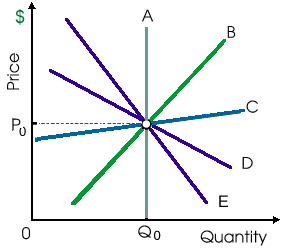
When curve C reflects the long run supply curve as in demonstrated figure for this industry, in that case this is a/an: (w) decreasing cost industry. (x) increasing cost industry. (y) constant cost industry. (z) diseconomies of scale industry.
Hello guys I want your advice. Please recommend some views for above Economics problems.