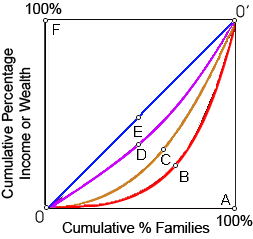
When this figure demonstrated Lorenz curves for distribution of income after taxes and transfers, in that case it is UNTRUE of the Lorenz curves demonstrated in this demonstrated figure that: (1) line 0E0' represents a Lorenz curve of perfect equality. (2) line 0A0' represents a Lorenz curve where only one family receives income. (3) line 0D0' shows a more equal distribution of income than line 0C0'. (4) an increase in income tax progressivity would be likely to move the Lorenz curve from line 0D0' to line 0C0'.
Hello guys I want your advice. Please recommend some views for above Economics problems.