--%>

Income tax rates and government transfer payments

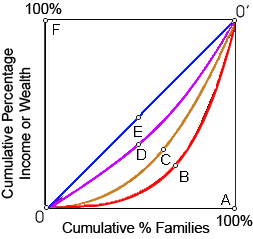
When line 0C0' in this figure shows the current Lorenz curve for the U.S. distribution of income after taxes and transfers, the probably short run outcomes of 10 percent cuts into both income tax rates and government transfer payments would be which the: (1) country's distribution of income would be unaffected. (2) country's after-tax and transfer Lorenz curve could shift to line 0B0'. (3) cuts could move the  Lorenz curve towards the line 0E0'of perfect equality. (4) country's after-tax and transfer Lorenz curve could shift to line 0D0'. (5) Lorenz curve would shift away by line OF0', the line of perfect inequity.

170_Problem on Lorenz Curve.png

I need a good answer on the topic of Economics problems. Please give me your suggestion for the same by using above options.

   Related Questions in Microeconomics

  • Q : What is demand schedule Demand schedule

    Demand schedule: This is a tabular symbolization of different quantities demanded at various levels of prices.

  • Q : Economies of scale exist in range of

    Natural monopoly refers to a market or industry in that: (w) economies of scale exist across much of the complete range of market demand. (x) superior management enables a firm to remove its competitors. (y) a firm produces a good protected through pa

  • Q : Monopsony and Marginal Resource Cost

    The labor monopsonist which doesn’t wage discriminates consists of a marginal resource cost curve [or marginal factor cost curve] which is above the labor supply curve then the firm faces as: (1) Monopsonists encompass market power in the markets for output. (2)

  • Q : Long run supply Illustrate and explain

    Illustrate and explain using diagrams, the difference between long run supply in a constant cost individual firm and industry and an increasing cost firm and industry.

  • Q : Area of Loren Curve This function as in

    This function as in illustrated figure area between A and B is termed as a/an: (1) index of inequality. (2) Lorenz curve. (3) Pareto indicator. (4) Gini coefficient. (5) Marx-Engels curve.

    Q : Relationship between Total utility and

    Describe the relationship between Total utility (TU) and Marginal utility (MU)? Answer:

    Q : Negatively-sloped demand curve for

    A firm which cannot price discriminate although which faces a negatively-sloped demand curve for output: (1) has a marginal revenue curve which is always below which demand curve. (2) will never knowingly produce at a level of output where the price e

  • Q : Question on elasticity of demand Select

    Select the right ans wer of the question. The demand for agricultural products is: A) relatively elastic with respect to price. B) relatively inelastic with respect to price. C) relatively elastic with respect to income. D) downward sloping to the individual farmer, b

  • Q : Labor Union History-AFL-CIO merger

    Preceding to the AFL-CIO merger in the year1955: (i) The AFL was an alliance of the industrial unions. (ii) The CIO was alliance of the craft unions. (iii) Strikes over which the unions would symbolize workers were common. (iv) The union movement was limited to public

  • Q : Relationship between APP-MPP If APP is

    If APP is at its maximum, then what is the relationship among MPP and APP? Answer: MPP = APP