--%>

Income elasticity of positive and increasing demand

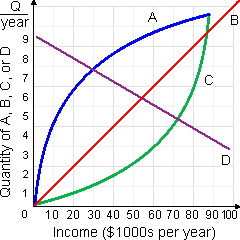
This given figure as in below demonstrates how consumption of goods A, B, C and D varies like a family’s income changes. Since income rises, the income elasticity of demand is positive and increasing for: (w) good A. (x) good B  (y) good C. (z) good D.

945_Income Elasticity of Demand.png

Can anybody suggest me the proper explanation for given problem regarding Economics generally?

   Related Questions in Microeconomics

  • Q : Controlling costs in the short run

    Executives at the helms of monopolies that may pay little attention to controlling costs within the short run, but during the long run the monopoly will tend to be operated into a technically efficient fashion since: (w) the firm will

  • Q : Marginal revenue product and MRP curve

    I have a problem in economics on Marginal revenue product or MRP curve. Please help me in the given question. Demand for the labor through a monopolist in the product market is its: (w) Value of marginal product (or VMP) curve. (x) Marginal revenue product (or MRP) cu

  • Q : Influence of Demand in the market price

    I have a problem in economics on Influence of Demand in the market price of good. Please help me in the following question. In short run, a demand curve would not shift the following a change in: (i) The size and distribution of national income. (ii)

  • Q : Area of Loren Curve This function as in

    This function as in illustrated figure area between A and B is termed as a/an: (1) index of inequality. (2) Lorenz curve. (3) Pareto indicator. (4) Gini coefficient. (5) Marx-Engels curve.

    Q : Income elasticity of demand Income

    Income elasticity of demand: Income elasticity of demand is the degree of receptiveness of demand to the modification in income.

    Q : Positively sloped resource supply curves

    When the resource supply curves of facing a competitive industry are positively sloped, in that case the exit of firms which have incurred losses will result within: (w) higher prices and lower output by each firm, and higher average production costs.

  • Q : Investment by profit-maximizing pure

    For such illustrated figure profit-maximizing pure competitor, there area aPed shows: (1) fixed cost (TFC). (2) average fixed cost (AFC). (3) the lowest possible economic loss. (4) maximum economic profits. (5) the rate of return on investment. <

  • Q : Price elasticity of demand as the

    The price elasticity of demand is approximately measured as the absolute value of as: (1) (% change in Q) / (% change in Y). (2) ratio of the slopes of demand relative to supply. (3) (% change in Q) / (% change in P). (4) constant slo

  • Q : Changing in marginal cost without price

    When this firm's marginal cost curve moved upward from MC2 to MC3, the firm would: (w) reduce output from Q3 to Q2 and increase price from P3 to P4. (x) reduce output by Q2 t

  • Q : Public policies to protect by limiting

    The government breakup of AT and T within various regional telephone companies and deregulating long distance services are illustrations of government: (w) enforcement of company size ceiling regulations. (x) creation of monopoly powers. (y) trying to