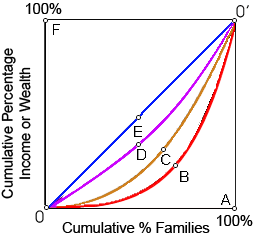
When line 0C0' shows the 1975 U.S. income distribution, in that case the 2005 income distribution would most likely be most probable: (1) line 0A0'. (2) line 0B0'. (3) line 0C0'. (4) line 0D0'. (5) line 0E0'.
Can anybody suggest me the proper explanation for given problem regarding Economics generally?