--%>

Income Distribution in Lorenz Curve

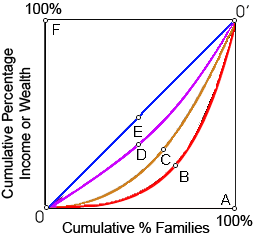
When line 0D0' represents the 1929s U.S. income distribution and line 0B0'shows the 1975 income distribution, in that case the 2005 year’s income distribution would be signified by: (i) line 0A0'. (ii) line 0B0'. (iii) line 0C0'. (iv) line 0D0'. (v) line 0E0'.

1580_Problem on Lorenz Curve1.png

Can someone explain/help me with best solution about problem of Economics ...

   Related Questions in Microeconomics

  • Q : Problem on Supply of Labor Can someone

    Can someone help me in finding out the right answer from the given options. The time in which people are willing and capable to work at different wage rates throughout a specific period is termed as the: (1) Labor force participation rate. (2) Supply of labor. (3) Mar

  • Q : Relative Prices of household

    When a household consumes just x and y, a higher price of y and the stable price of x will make: (i) All goods cheaper relative to the x. (ii) x cheaper relative to the y. (iii) Real family income grow. (iv) Substitution against x the more desirable.

    Q : Labor Force Participation Rates The

    The percentage of a specific population who is either unemployed or employed or is termed as the: (i) Labor force participation rate. (ii) Work-force proportion. (iii) Income-leisure loss curve. (iv) Substitution effect dominance rate. (v) Labor supply.

  • Q : Estimate price by price elasticity of

    At the point on the demand curve for RoboMaids where the price elasticity of demand is unitary, the price would be roughly: (i) $10,000, resulting in sales of roughly 16,000 robots monthly. (ii) $13,000, resulting in sales of approxim

  • Q : Economic foundations of the single tax

    The economic foundations of the single-tax progress were first presented through: (1) British Prime Minister Lloyd George. (2) John Stuart Mill. (3) Henry George. (4) David Ricardo. (5) George Stigler. How can I so

  • Q : Problem on cross-price elasticity Kathy

    Kathy purchases two goods, t-shirts and caps.  Her demand for t-shirts is: Qt = 44 – 3Pt - Pc + .04IThe price of caps is Pc = $2. And her income is I = $300.a. Graph a demand curve for Kathy’s t-shirts.

  • Q : LEAST affected market interest rate

    Market interest rates are LEAST affected through: (w) people’s willingness to defer consumption when they are rewarded for doing so. (x) people’s desires for liquidity. (y) the marginal productivity of new capital relative to its price. (z

  • Q : Deter entry from potential competitors

    A firm along with important market power which builds an additional plant to increase excess capacity may be trying to as: (w) ignore a depletion of inventory. (x) deter entry from potential competitors. (y) increase demand and thus raise price and pr

  • Q : Unitarily elasticity in supply curve At

    At point b, in demonstrated figure the supply curve into this graph is: (w) perfectly elastic. (x) elastic, but not perfectly that why. (y) unitarily elastic. (z) inelastic.

    Q : What is Budget line Budget line : This

    Budget line: This refers to all combinations of goods that a consumer can purchase with his whole income and price of two goods.