--%>

Income distribution after taxes and transfers

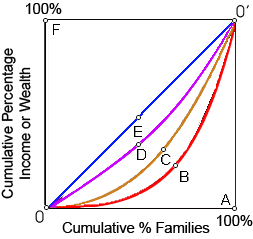
When line 0C0' shows income distribution before taxes and transfers, in that case the line that shows income distribution after taxes and transfers would be: (1) line 0A0'. (2) line 0B0'. (3) line 0C0'. (4) line 0D0'. (5) line 0E0'.

1810_Problem on Lorenz Curve1.png

Hey friends please give your opinion for the problem of Economics that is given above.

   Related Questions in Microeconomics

  • Q : Reasons of rent controls set under

    Rent controls set under equilibrium tend to cause: (w) simpler access to affordable housing. (x) apartment construction to boom. (y) the quantity and upkeep of rental units to fall. (z) less racial discrimination within housing.

    Q : Help The problem of asymmetric

    The problem of asymmetric information is that

  • Q : Aggregate Supplies of Labor The

    The Supplies of labor from a specified population mainly depend on the: (1) Structure of wage rates. (2) Labor force participation rates of different population sub-groups. (3) Individual preferences for the work and income versus the leisure. (4) Levels of investment

  • Q : Barriers prevent entry in long run

    Within the long run, a monopoly cannot continually produce economic profit unless: (w) economies of scale are important. (x) corporate taxes are lowered. (y) barriers to entry are significant. (z) the monopolist maximizes profit.

  • Q : Power monopsonist I have a problem in

    I have a problem in economics on Power of monopsonist. Please help me in the given question. The firm which is the sole buyer of a specific good or resource is a: (m) Monopsonist. (n) Plutocracy. (o) Bilateral monopolist. (p) Price discriminator. (q) Conglomerate.

  • Q : Sustained rates of economic development

    Sustained rates of economic development which exceeded population growth rates would: (w) raise the incomes of the poor without reducing anybody else’s income. (x) raise the incomes of everyone in society. (y) boost the incomes of the poor only

  • Q : High relative income define by Census

    The Department of the Census defines high relative income as experienced while families: (w) earn more than $60,000 annually per worker in the family. (x) have income which is twice the median incomes of other American families. (y) e

  • Q : Quantity demanded grows with price cut

    A price elasticity of demand coefficient of 2.5 approximately implies that: (1) quantity demanded rises 1 percent while price rises 2.5 percent. (2) quantity demanded grows 2.5 percent along with a 1 percent price cut. (3) price rises 2.5 percent whil

  • Q : Price elastic of supply between two

    In between point c and d in this supply curve of 2×4s, the price elastic of supply as: (i) 1.0. (ii) 1.6. (iii) 2.2. (iv) 2.8. (v) 3.4.

    Q : Break-even level of income The

    The break-even level of income for four member of family under the negative income tax system demonstrated in this figure is: (1) $15,000 per year. (2) $30,000 per year. (3) $45,000 per year. (4) $60,000 per year. (5) $75,000 per year