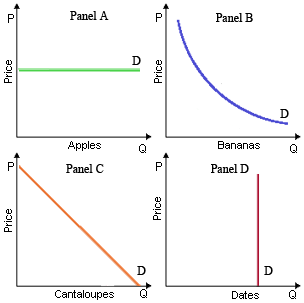
Illustration of perfectly price elastic demand curve
A demand curve which is perfectly price elastic is demonstrated into: (w) Panel A. (x) Panel B. (y) Panel C. (z) Panel D. How can I solve my Economics problem? Please suggest me the correct answer.
A demand curve which is perfectly price elastic is demonstrated into: (w) Panel A. (x) Panel B. (y) Panel C. (z) Panel D.
How can I solve my Economics problem? Please suggest me the correct answer.
The removal of exploitation of labor (or wage payments beneath the value to the society of each and every individual worker’s productive contribution) is automatic when business decision makers: (1) Should set wages via collective bargaining agreements by labor
Monopolistic competitors generate levels of output which are: (w) more than socially optimal and equitable. (x) economically efficient. (y) where marginal social benefits exceed marginal social costs. (z) certain to generate economic profits.
The demand curve facing an unregulated non-discriminating monopolist is NOT: (w) similar as the industry's demand curve. (x) downward sloping. (y) more elastic than the demand curve facing a competitive firm. (z) various from its marg
Describe the relation between average revenue and marginal revenue. whenever a firm can sell an extra unit or a good by lowering price.
A Rise in the quantity of frozen vegetarian lasagna demanded would be much probable to outcome from raises in the: (i) Cost of raw vegetables. (ii) Wages paid workers in lasagna developed plants. (iii) Number of people who perform strict vegetarianism. (iv) Costs of o
The economy consists of two consumers, A and B. Both consumers are endowed with one unit of good 1 and one unit of good 2. Consumer A is entirely indifferent between all consumption plans. Consumer B has the utility function u(xB1 ; xB
The union strategy which prevents the non-union employees of the firm from being free riders is to negotiate a contract which needs the firm to be a/an: (i) Agency shop. (ii) Open shop. (iii) Collective bargaining shop. (iv) Closed shop. (v) Union shop.
When a firm shuts down, short-run losses of it equals total: (w) implicit costs. (x) variable costs. (y) fixed costs. (z) resource costs. I need a good answer on the topic of Economics problems. Pl
The slope of the ray by the origin which is tangent to point b equivalents to: (w) the reciprocal of the price elasticity of demand. (x) P / Q. (y) 0a / 0c. (z) the price elasticity of supply. Q : Backward Bending Labor Supplies Graph Graph for the supply of labor might be backward bending since: (i) The substitution effect overtakes the income effect at some wages. (ii) Overtime workers get pay for time and a half. (iii) The substitution effect. (iv) The income effect is much powerful than substit
Graph for the supply of labor might be backward bending since: (i) The substitution effect overtakes the income effect at some wages. (ii) Overtime workers get pay for time and a half. (iii) The substitution effect. (iv) The income effect is much powerful than substit
18,76,764
1960819 Asked
3,689
Active Tutors
1420200
Questions Answered
Start Excelling in your courses, Ask an Expert and get answers for your homework and assignments!!