--%>

Illustrates average variable cost curve

LoCalLoCarbo has become the favorite of fad dieters. There in curve E shows: (1) LoCalLoCarbo’s marginal cost curve. (2) LoCalLoCarbo’s average variable cost curve. (3) LoCalLoCarbo’s average total cost curve. (4) the market demand curve facing LoCalLoCarbo. (5) LoCalLoCarbo’s marginal revenue curve.
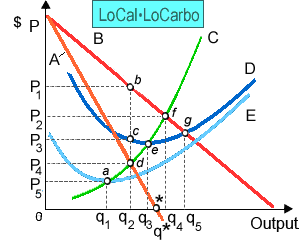
1846_Market Power and Marginal Revenue.png

Hello guys I want your advice. Please recommend some views for above Economics problems.

   Related Questions in Microeconomics

  • Q : Profit or loss in purely competitive to

    When the wholesale price P = $5 per dozen roses, this purely competitive rose farm maximizes profit through producing ___ dozen roses at a total (loss or profit) of $___. (1) zero; loss; $2000. (2) 2000; loss; $1500.

  • Q : Labor Unions Strikes-Lockouts Can

    Can someone please help me in finding out the accurate answer from the following question. Whenever unions and managements have failed to arrive at a collective bargaining agreement and management closes the production facilities to exert pressure on the union negotia

  • Q : Monopsonist-marginal resource cost Can

    Can someone please help me in finding out the accurate answer from the following question. The monopsonist will hire the labor until labor's marginal resource cost equivalents the: (i) Marginal revenue product of the labor. (ii) Marginal physical product. (iii) Value

  • Q : Capital Market in Private Economy This

    This capital market is within this illustrated figure a closed private economy. The first plans of savers and investors are demonstrated as curves S0 and I0. There market equilibrium will exist at: (1) point a. (2) point b. (3) point

  • Q : Natural monopolies closely regulated by

    Inside the United States, public utilities like natural gas lines or electric companies are frequently: (w) quite competitive while they vie for the consumer's dollars. (x) natural monopolies which are closely regulated by government. (y) seldom closely regulated thro

  • Q : Least likely example of Substitution

    Can someone please help me in finding out the accurate answer from the following question. Assume that the War in Iraq spilled over into another oil exporting countries. When U.S. gasoline prices rose to, state, $10 per gallon, the least likely outcome would be that:

  • Q : Total fixed cost Total fixed cost: 1.

    Total fixed cost: 1. Fixed cost remains constant at each level of output ie it do not change with change in quantity.2. It can not be zero when output is zero.3. Its curve is parallel to X-aixs4.

  • Q : Demands for Labor-Trade off work The

    The demands for labor mainly based on LEAST on the levels of: (i) Labor productivity. (ii) Technology and amounts of other resources used. (iii) Demand for the final products. (iv) Trade-off between work (producing income) and free time.

  • Q : Equilibrium price of commodity Describe

    Describe why the equilibrium price of commodity is determined at the level of output at which its demand equavalents its supply.

  • Q : Limitation of economies capacity I have

    I have a problem in economics on Production Possibilities Frontiers. Please help me in determining the right answer from the following question. The economy’s capacity to generate/make is NOT limited by the: (i) Amount of resources accessible. (