The U.S. market for rice is illustrated below.
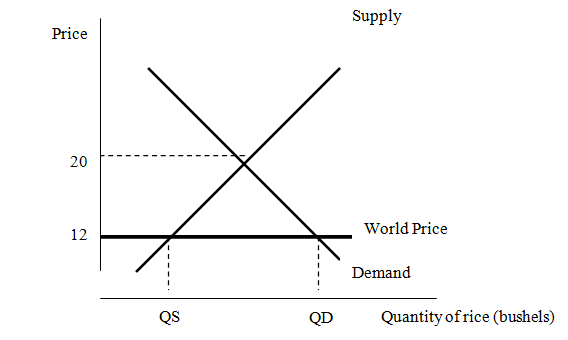
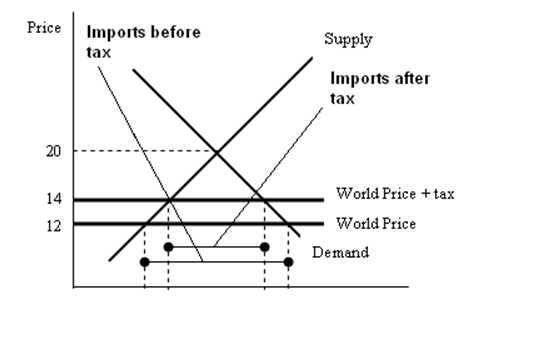
The world price of rice is $12 per bushel and the U.S. can purchase all of the rice that it desire at that price. The government places tax on imported rice of $2 per bushel. Illustrate the effect of this tax on the graph above. What will turn out to the amount of rice the U.S. imports?
The tax will raise the world price of rice to $14. Therefore, the U.S. will import less rice