--%>

Government rent control imposing

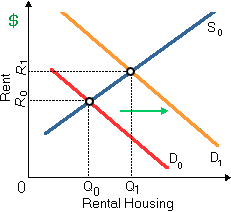
When government rent controls are imposed at R0 when demand equals D0 and then demand changes to D1, there is the: (w) quality of housing is likely to enhance. (x) housing market will be plagued through shortages. (y) price ceiling will create surplus rental units. (z) construction of new rental housing will boom.

1717_supply and demand curves for housing.png

Please choose the right answer from above...I want your suggestion for the same.

   Related Questions in Microeconomics

  • Q : Monopolistic and competitive tools in

    Most markets into the American economy are: (i) purely competitive. (ii) primarily unregulated monopolies. (iii) blends of monopolistic and competitive tools. (iv) dominated by regulated monopolies. (v) governed through the decisions of political lead

  • Q : Gaining more Consumer Surplus I have a

    I have a problem in economics on gaining more Consumer Surplus. Please help me in the following question. Sushi lovers would be most probable to gain more consumer surplus as an outcome of rises in the: (i) Price of the steamed rice. (ii) Supply of sushi. (iii) Income

  • Q : What will be included in illustrations

    Illustrations of price floors comprised: (1) agricultural subsidies upon, for example: corn. (2) usury laws, that are limits on the interest rates on loans. (3) utility rate structures upon natural gas or electricity. (4) rent controls in London, San

  • Q : Price of related goods-consequence on

    Price of related goods: a) Substitute goods – Whenever the price of substitute goods raises they become dearer whenever the price replaces goods falls they bec

  • Q : Define Economics Briefly describe the

    Briefly describe the term economics?

  • Q : Price elasticity beside horizontal

    Hey FRIEND I need your help for query as given below: The price elasticity beside a horizontal demand curve is constant at: (w) zero. (x) infinity. (y) 1. (z) -1. Can someone ex

  • Q : Problem related to aggregate demand

    Refer to the below diagram, in which Qf is the full-employment output. If aggregate demand curve AD1 describes the current situation, appropriate fiscal policy would be to: A) increase taxes and reduce government spending to shift the aggregate d

  • Q : Break-even level of income under

    For a family of four the break-even level of income under the negative income tax system demonstrated in this figure is: (1) $15,000 per year. (2) $30,000 per year. (3) $45,000 per year. (4) $60,000 per year. (5) $75,000 per year.

  • Q : Market demand with market power

    LoCalLoCarbo has turn into the favorite of fad dieters. There in illustrated graph curve B shows: (i) LoCalLoCarbo’s marginal cost curve. (ii) LoCalLoCarbo’s average variable cost curve. (iii) LoCalLoCarbo’s average total cost curve. (iv) the market

  • Q : Capital Market in Private Economy This

    This capital market is within this illustrated figure a closed private economy. The first plans of savers and investors are demonstrated as curves S0 and I0. There market equilibrium will exist at: (1) point a. (2) point b. (3) point