--%>

Formulating linear program of a Software company

A software company has a new product specifically designed for the lumber industry. The VP of marketing has been given a budget of $1,35,00to market the product over the quarter. She has decided that $35,000 of the budget will be spent promoting the product at the national trade show in New Orleans which will be held during this planning quarter.

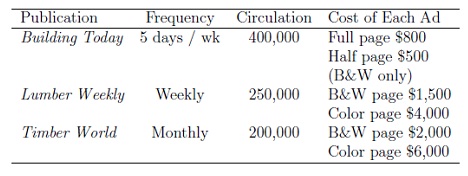
Because eh product targets a specialized audience the VP has ruled out television radio and mainstream magazine advertisements. Instead she has decided to promote the product using black and white (B &W) and color ads in some or all of the followings specialized publications: Building today lumber weekly and timber world building today is a week day trade newspaper that accepts both full page and half page black and white advertising. Lumber weekly and timber world are glossy magazines that run both black and white and color ads. The VP and her staff have decided to run only full page ads in these last two publications. The circulation and advertising cost data for each outlet is summarized in the following table:

1758_softyarwe.jpg

After a discussion of the potential advertising the marketing team made the following judgment:

• A maximum of one ad should b placed in any one issue of any of the trade publications during the quarter:
• At least 50 full page ads should appear during the quarter:
• At least eight color ads should appear during the quarter:
• One ad should appear in each issue of timber world:
• At least four weeks of advertising should be placed in each of the building today and lumber weekly publications:
• No more than $40,000 should be spent on advertising in any one of the trade publications.

Formulate a linear programming model that will provide the VP and her marketing staff a marketing plan for the next quarter to maximize audience exposure for their new software product.

Implement your formulation in excel and find the optimal solution using solver. Sum marize your solution (decision variable values and objective function value ) below your formulation.

   Related Questions in Mathematics

  • Q : Research Areas in Medical Mathematical

    Some Research Areas in Medical Mathematical Modelling:1. Modeling and numerical simulations of the nanometric aerosols in the lower portion of the bronchial tree. 2. Multiscale mathematical modeling of

  • Q : Numerical solution of PDE i want you to

    i want you to solve this assignment. this consist of two parts theoretical and coding. the code has to be created by you. no modified or copying code. you have to mention the exact solution and the proportion error. also you have to explain the sketch that you get from the code. these information

  • Q : Explain Black–Scholes model Explain

    Explain Black–Scholes model.

  • Q : Explain lognormal stochastic

    Explain lognormal stochastic differential equation for evolution of an asset.

  • Q : Problem on Linear equations Anny, Betti

    Anny, Betti and Karol went to their local produce store to bpought some fruit. Anny bought 1 pound of apples and 2 pounds of bananas and paid $2.11.  Betti bought 2 pounds of apples and 1 pound of grapes and paid $4.06.  Karol bought 1 pound of bananas and 2

  • Q : Define Well-formed formulas or Wffs

    Wffs (Well-formed formulas): These are defined inductively by the following clauses:    (i) If  P  is an n-ary predicate and  t1, …, tn are terms, then P(t1, …, t

  • Q : Who derived the Black–Scholes Equation

    Who derived the Black–Scholes Equation?

  • Q : How to get calculus homework done from

    How to get calculus homework done from tutor

  • Q : The mean of the sampling distribution

    1. Caterer determines that 87% of people who sampled the food thought it was delicious. A random sample of 144 out of population of 5000 taken. The 144 are asked to sample the food. If P-hat is the proportion saying that the food is delicious, what is the mean of the sampling distribution p-hat?<

  • Q : Use MS Excel to do the computations

    Select a dataset of your interest (preferably related to your company/job), containing one variable and atleast 100 data points. [Example: Annual profit figures of 100 companies for the last financial year]. Once you select the data, you should compute 4-5 summary sta