--%>

Find out marginal cost curve

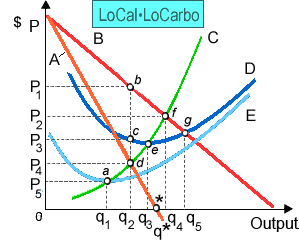
LoCalLoCarbo has turn into the favorite of fad dieters. Therefore in illustrated figure there curve C shows: (1) LoCalLoCarbo’s marginal cost curve. (2) LoCalLoCarbo’s average variable cost curve. (3) LoCalLoCarbo’s average total cost curve. (4) the market demand curve facing LoCalLoCarbo. (5) LoCalLoCarbo’s marginal revenue curve.

738_Market Power and Marginal Revenue.png

I need a good answer on the topic of Economics problems. Please give me your suggestion for the same by using above options.

   Related Questions in Microeconomics

  • Q : Central bank executes clearing house

    Central bank executes the function of a clearing house. Explain how? Answer: Each and every bank keeps cash reserves with central bank. The claims of banks against

  • Q : Hypothetical demands for perfect price

    In this figure demonstrating hypothetical demands for socket sets, there demand curve: (1) D1D1 is perfectly price-inelastic. (2) D2D2 is perfectly price elastic. (3) D3D3

  • Q : Concept of pure rent in economics Pure

    Pure economic profit is most closely associated to the concept of: (1) exploitation of labor. (2) opportunity cost. (3) pure rent. (4) pure oligopoly. (5) capitalization. I need a good answer on the topic of

  • Q : Should third World limit pollution ‘In

    ‘In developing countries there are some controls on aspects of pollution like exhaust fumes. How would you evaluate whether these countries, from their point of view, must invoke legislation to enhance the atmosphere in these respects?’

  • Q : Why are buyers and sellers forced to be

    Several buyers and sellers are forced to be price-takers since: (w) vigorous competition maintains individuals from noticeably influencing the market. (x) only monopoly firms adjust quantities. (y) markets adjust slowly. (z) quantity adjustment is not

  • Q : Equilibrium quantity and price

    Elucidate the consequence of an increase in demand of a commodity on its equilibrium quantity and price? Answer: Increase in demand causes a rightward shift in the

  • Q : Illustrations of Predatory Behavior

    Tactics as like [a] lowering prices, [b] expanding output beyond a short run profit maximizing level, and [c] aggressively advertising or redesigning existing products to make them incompatible along with rivals’ products are most likely to be interpreted as ill

  • Q : Illustration of Economic Capital An

    An illustration of economic capital would be: (1) loanable funds in banks. (2) factory buildings. (3) gold held through price speculators. (4) labor’s productive skills. (5) corporate stocks. How can I solve

  • Q : Determine free-market equilibrium price

    In the year of 1983, the Reagan Administration introduced a new agricultural program known as the Payment-in-Kind Program. To distinguish how the program worked, let's assume the wheat market. Assume the demand function is QD = 28 - 2P and the supp

  • Q : Classification of Surveys as

    Surveys can be classified as probabilistic sampling: • Simple random sampling: If you have a relatively small, self-contained, or clearly stated population, suc