--%>

Explain Production Possibility curve

Elucidate Production Possibility curve with the help of a diagram?

Answer: The Production Possibility Curve refers to a curve that shows various production possibilities which can be produced with specified resources and technology.

920_PPC.jpg

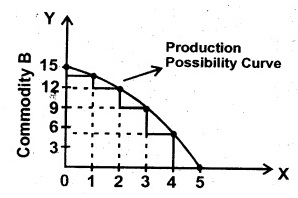
When the economy devotes all its resources to the production of commodity B, it can generate 15 units however then the production of commodity A will be zero. There can be much production possibilities of commodity A & B. When we want to generate more commodities B, we have to decrease the output of commodity A and vice-versa.

   Related Questions in Microeconomics

  • Q : Break-even on profit-maximizing strategy

    Robomatic Corporation would exactly break-even upon its RoboMaids when, instead of exactly identifying its profit-maximizing strategy, this: (i) operated at point i, charging only $10,000 per unit and producing 16,000 robots. (ii) pri

  • Q : Maximize profits by oligopoly An

    An oligopoly will maximize profits when this produces where: (w) MR > MC. (x) MR = MC. (y) TR = TC. (z) MR > P. Can anybody suggest me the proper explanation for given problem regarding Economics

  • Q : Monopsonistic Exploitation Can someone

    Can someone help me in finding out the right answer from the given options. The employer with monopsony power exploits the labor if it pays a wage: (i) At a bare subsistence level. (ii) That stabilizes worker population. (iii) Less

  • Q : Equilibrium moves market reduce in

    When equilibrium moves from point a to point b, the simple market experiencing a reduce in supply is demonstrated within: (w) Panel A. (x) Panel B. (y) Panel C. (z) Panel D.

    Q : Price of a Financial Asset When the

    When the price of a financial asset of price $10,000 and the interest rate is 10 percent, investment is NOT justified for: (w) a perpetuity paying $1,000 annually. (x) an asset paying respectively as $5,000, $4,000, a

  • Q : Demand for a good at price elasticity

    The curve which could demonstrate the demand for a good which has price elasticity equal to one is within: (w) Panel A. (x) Panel B. (y) Panel C. (z) Panel D.

    Q : Definition of Consumer Surplus The

    The difference among the price a consumer would have been eager to pay for the commodity and the price consumer really has to pay is termed as: (i) Gain. (ii) The substitution effect. (iii) The income effect. (iv) Consumer surplus.

  • Q : Marginal revenue when market price

    When the market price of a good is $50 and a purely competitive firm raises its output from 20 units, marginal revenue of it is: (w) $50. (x) $1000. (y) $2.50. (z) $0.40. I need a good answer on th

  • Q : Problem on Budget constraints James and

    James and Louisa each have an income of $30, which they each spend on tomatoes and all other goods.  They buy tomatoes at their local farmers market, which charges $3 per pound.  Define the units for all other goods so that their price is $1 per unit. 

  • Q : Demand curve consequent to output An

    An unregulated monopoly which does not price discriminate sets price in accord along with the: (w) height of the graph where marginal revenue equals average total costs [MR = ATC]. (x) height of the graph where marginal costs equal av