Butterfly Spread Strategies: In this strategy, there is no limit on the number of options that can be combined to form the butterfly spread. This strategy essentially combines both the bear spread and the bull spread. In this case, options with three different exercise prices are used – K1, K2 and K3. Through the use of calls only, the trader would hold a long position in calls with strike prices K1 and K3 while short two calls that have the exercise price of K2 each. It is also assumed that the exercise prices are equally spaced. Thus the value of the option at expiration can be expressed as:
Value = max (0, ST – K1) – 2 * max (0, ST – K2) + max (0, ST – K3).
The initial outflow in the form of option premiums would be c1 – 2 * c2 + c3. This value would always be positive since the lower exercise price of the call option bought (K1) would be lower than the lower exercise of the bull spread sold (K2). The profit which would result from this arrangement is given by:
Profit = max (0, ST – K1) – 2 * max (0, ST – K2) + max (0, ST – K3) – c1 + 2c2 – c3.
If the price at expiration is between the ranges of K1 and K3, there is a net loss as the loss on the two short calls exceeds the gain from the long call (at the lowest exercise price of K1). This strategy that has been described works in situations when it is expected that the aggregate volatility of the market would be relatively low. If the trader expects that the markets would be highly volatile, then it would be better to short the butterfly spread. The payoff diagram along with the values and profits in different scenarios has been represented in the following graph:
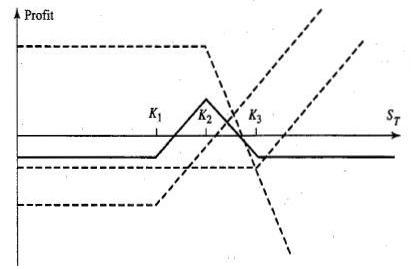
It can be seen from the above graph that the long butterfly spread strategy profits only when the volatility of the prices is low. The losses as well as the gains are both limited. The maximum loss is capped at the total premium outflow which occurs at the onset while the maximum profit occurs when the stock’s price at expiration is precisely equal to the middle exercise price. At this price, both the short calls as well as the long call with the highest exercise price exercise worthless while the gain accrues from the call option which has the lowest exercise price.
Alternatively, a butterfly strategy can also be constructed using put options. In this case, if the investor believes that the volatility of the market would be low, then a long position in the spread would have to be taken which implies buying the puts with the exercise prices of K1 and K3, while selling the put options which have the exercise price of K2.