--%>

Excess of good in market problem

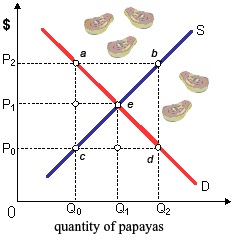
The excess of papayas would appear when: (1) seller’s supply prices increase to P1. (2) Govt. set a price ceiling of P1. (3) Growers predicted prices to soar. (4) Hurricane destroyed all Central American papaya plantations. (5) Government obliged a price floor of P2.

2082_10.jpg

Please someone suggest me the right answer.

   Related Questions in Microeconomics

  • Q : Variation in supply and demand curves

    These supply and demand curves for housing do NOT involve that the: (w) demand for housing has increased. (x) supply has increased, because rental price has risen. (y) equilibrium price and quantity of housing have increased. (z) housing market will c

  • Q : Yellow dog contracts-collective

    The summation of monopolistic exploitation across all the workers tends to raise however a firm as well operates at a more communally and economically proficient level of output and employment whenever the firm is capable to engage in: (i) Black-listing in its dealing

  • Q : Determine highest incomes at specific

    Salespeople as illustrated in graph who earn percentage commissions upon the total revenue from DVD games would create their highest incomes at specific price of: (w) $50. (x) $25. (y) $10. (z) zero.

    Q : Comparison of absolute intensity among

    The absolute intensity of one consumer’s preferences and tastes as compared to the absolute intensity of the other consumer’s tastes and preferences is as: (1) Dependent on the supplies of specific products. (2) Individually recognized in

  • Q : Illustration of limit pricing strategy

    An illustration of limit pricing strategy occurs while the incumbent firm: (w) sets a price below costs to drive its competitor out of the market. (x) redesigns its product lines to create components incompatible along with rivals. (y) which has a cos

  • Q : Relationship between APP-MPP If APP is

    If APP is at its maximum, then what is the relationship among MPP and APP? Answer: MPP = APP

  • Q : Isoquants and isocost lines By using

    By using isoquants and isocost lines, illustrates graphically that rise in y will result in a decline in the quantity demanded of x1 and also illustrates that rise in the price of x1 will result in a reduction in the quantity demanded of x1<

  • Q : Calculating Firms accounting profit I

    I have a problem in economics on Calculating Firms accounting profit. Please help me in the following question. The firm has $50,000 in implicit costs, and the economic profit of $10,000. This firm’s: (i) Explicit cost equivalent $40,000. (ii) Accounting profit

  • Q : Price elasticity of demands for moving

    Moving from point d to point e beside demand curve D, the price elasticity of demands of DVDs of video games at equal: (a) 0.8. (b) one. (c) 1.10. (d) 1.25. (e) 2.50

    Q : Less equally distribution of wealth In

    In the United States, wealth appears to be: (1) more equitably distributed than income tax burdens. (2) less equally distributed than income. (3) distributed much more equally than in communist countries. (4) weak in generating income for wealthy indi