--%>

Estimate price by price elasticity of unitary demand

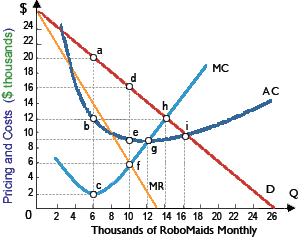
At the point on the demand curve for RoboMaids where the price elasticity of demand is unitary, the price would be roughly: (i) $10,000, resulting in sales of roughly 16,000 robots monthly. (ii) $13,000, resulting in sales of approximately 13,000 robots per month. (iii) $16,000, resulting in sales of approximately 10,000 robots per month. (iv) $20,000, resulting in sales of about 6,000 robots per month. (v) $23,500, resulting in approximately 1,800 robots being sold each month.

1740_Elasticity and profit.png

I need a good answer on the topic of Economics problems. Please give me your suggestion for the same by using above options.

   Related Questions in Microeconomics

  • Q : Price elasticity of demand as the

    The price elasticity of demand is approximately measured as the absolute value of as: (1) (% change in Q) / (% change in Y). (2) ratio of the slopes of demand relative to supply. (3) (% change in Q) / (% change in P). (4) constant slo

  • Q : Breaks even point Hey friends I need

    Hey friends I need your help to solve out this problem regarding to a purely competitive firm breaks even while: (w) MR = MC (x) TR = TC (y) MC > MR (z) TR > TC. Can someone suggest me the ri

  • Q : State microeconomic Choose

    Choose microeconomic statement from following A) The real domestic output increased by 2.5 percent last year. B) Unemployment was 6.8 percent of the labor force last year. C) The price of personal computers declined last year. D) The general price level increased by 4

  • Q : Problem on marginal returns Select the

    Select the right ans wer of the question. Refer to the following data. Diminishing marginal returns become evident with the addition of the: A) sixth worker B) fourth worker. C) third worker. D) second worker.

    Q : Arc elasticity of demand The arc

    The arc elasticity of demand of Bosun for labor in between point f and point g is approximately: (1) one. (2) 1.250. (3) 1.375. (4) 1.500. (5) 1.750.

    Q : Lorenz curve as graphical device A

    A Lorenz curve is graphical device which can be utilized to portray the: (w) number of people below the poverty level. (x) conflict between high tax rates and high tax revenues. (y) relative inequalities in the distribution of a variable across a popu

  • Q : Principles of Macroeconomics Questions

    (a) Explain the relationship between full employment of resources and full production. (b) Look at the following production possibilities curve illustrating the possibilities in Sluggerville for producing bats and/or p

  • Q : Positively-sloped supply curve

    A straight-line, which positively-sloped supply curve which starts from the quantity axis is: (w) elastic for all prices and quantities. (x) inelastic for all prices and quantities. (y) unitarily elastic for all prices and quantities. (z) a sign that

  • Q : Monopolistic Exploitation dilemma In

    In equilibrium for the price maker firm, the rate of monopolistic exploitation is the difference between: (p) P and MR. (q) P and MC. (iii) Total revenue and net cost per unit of output. (r) Output price and rate of monopsonistic exploitation. (s) VMP and MRP.

  • Q : Hire labor at any amount in purely

    When this purely competitive firm can hire any amount of labor at pre hour wage of $9 per worker, in this given figure, as it will hire: (1) L2 workers. (2) L3 workers. (3) L4 workers. (4) L5 workers. (5) L<