--%>

Estimate minimum average costs

Robomatic Corporation could attain minimum average costs for RoboMaids when this produced: (1) 4,000 robots per month. (2) 6,000 robots per month. (3) 8,000 robots per month. (4) 10,000 robots per month. (5) 12,000 robots per month.
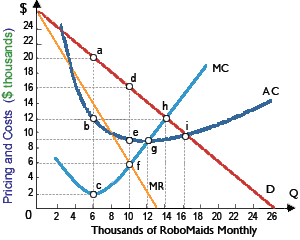
488_Elasticity and profit.png

Hey friends please give your opinion for the problem of Economics that is given above.

   Related Questions in Microeconomics

  • Q : Change in supply of good and in price

    When a change in the supply of a good causes a percentage change within price which exceeds in absolute value the resulting percentage change within quantity demanded, then demand is relatively: (1) price elastic. (2) inferior. (3) no

  • Q : Generates price-quantity consistent for

    All prospective demanders [buyers] would be within equilibrium when this market for teleporter buttons created a price and a quantity consistent along with: (1) eliminating the shortage Q1-Q3 existing at P3<

  • Q : Coefficient of elasticity of relatively

    Please help me to solve the problem that is given below: A relatively price elastic demand curve would consist of a coefficient of elasticity of as: (w) ep = 1. (x) ep > 1. (y) ep < 1. (z) ep

  • Q : Define Marginal Cost or MC Define

    Define Marginal Cost and also its functions?

  • Q : Zero economic profits in long-run

    In long-run equilibrium, a monopolistically competitive firm is making: (a) economic profits. (b) zero economic profits. (c) negative economic profits. (d) revenues that exceed total costs. Can anybody suggest me t

  • Q : Problem on Multiple regression analysis

    Find two journal articles that have undertaken multiple regression analysis and compare the results. Specify the reference for the two papers.Requirements:

    Q : Causes of Increase in demand Describe

    Describe the causes of Increase in demand?Answer: 1) Increase in income of the consumer.2) Price of substitute goods increase.3)

  • Q : Unitarily elasticity in supply curve At

    At point b, in demonstrated figure the supply curve into this graph is: (w) perfectly elastic. (x) elastic, but not perfectly that why. (y) unitarily elastic. (z) inelastic.

    Q : Backward bending-supply curve of labor

    Supply curve of the labor is LEAST probable to be ‘backward bending’ for: (i) An individual worker. (ii) The economy as an entire. (iii) Highly specialized industries which are major employers of the specialized PhDs hired only after 10 years of experience