--%>

Equilibrium price level and level of real domestic output

Assume that aggregate demand and the short run supply for a hypothetical economy are as illustrated below:


608_Hypothetical economy.png

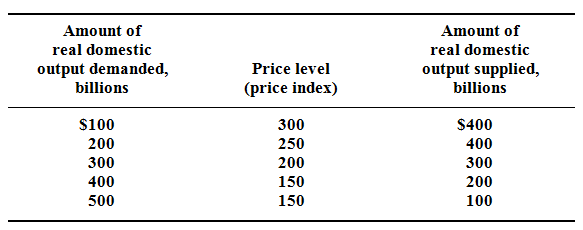
Employ these sets of data to graph the aggregate demand and supply curves. Determine the equilibrium price level and level of real domestic output in this supposed economy? Is the equilibrium real output also the absolute full capacity real output? Describe.

E

Expert

Verified

Observe the graph. Equilibrium price level will be 200. Equilibrium real output will be $300 billion. No, the full-capacity level of GDP= $400 billion, where the AS curve becomes vertical


1907_aggregate demand and supply curves.png

   Related Questions in Finance Basics

  • Q : Equilibrium interest rate Normal 0

    Normal 0 false false

  • Q : All rates are stated annually with

    1.      Assume the following (all rates are stated annually with semiannual compounding):

  • Q : Resources flow Normal 0 false false

    Normal 0 false false

  • Q : Define Schedule Schedule : The

    Schedule: The explanation of an appropriation in the Budget Bill or Act, exhibiting its distribution to each of the programs, categories, or therefore projects. OR The supplemen

  • Q : What are Summary Schedules Summary

    Summary Schedules: Different schedules in the Governor’s Budget Summary that summarize state revenues, expenditures and other fiscal and personnel data for the past, present, and budget years.

  • Q : How do mergers influence small

    How do mergers influence small businesses?According to a recent study through Federal Reserve & Wharton Financial Institutions Center economists, not a great deal. Their analysis revealed that acquisitions don't seem to be related with a sig

  • Q : Slope of the budget line and the

    Consider someone won $15 on a Lotto Canada ticket at the local 7-Eleven & decided to spend all the winnings on bags of peanuts and candy bars. The cost of candy bars is estimated as $.75 and the cost of peanuts is $1.50. Plot the data in this table as a budget li

  • Q : Problem of time lags in enacting and

    Normal 0 false false

  • Q : Explain marginal cost of capital

    Explain marginal cost of capital schedule (MCC)? Is the schedule always horizontal line? Describe. The marginal cost of capital schedule is graphic depiction of the weighted average cost of capital at distinct levels of financing. The MCC sch

  • Q : Define Cost-of-Living Adjustments

    Cost-of-Living Adjustments (COLA): Increases offered in state-funded programs which comprise periodic adjustments predetermined in state law (statutory, like K-12 education apportionments), or established at optional levels (that is discretionary) by