Elimination of discrimination
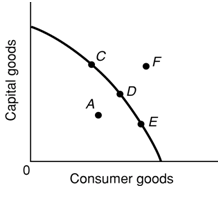
In the following diagram, the elimination of discrimination is best depicted by: 1) a move from C to E. 2) an inward shift of the production possibilities curve. 3) a move from A to D. 4) a move from E to C.
Can someone help me in finding out the right answer from the given options. The principal who observes the qualifications of a potential agent prior to offering the agent a contract is engaging in the procedure of: (1) Signaling. (2) Finding out an efficient wage. (3)
Which of the statements regarding elasticity is correct? A) Supply is more elastic in the short run than in the long run. B) Demand is more elastic in the short run than in the long run. C) Demand is more elastic when a large number of substitute goods are avail
LoCalLoCarbo has turn into the favorite of fad dieters. Therefore in illustrated figure there curve C shows: (1) LoCalLoCarbo’s marginal cost curve. (2) LoCalLoCarbo’s average variable cost curve. (3) LoCalLoCarbo’s average total cost curve. (4) the
Compared with the price taker in labor market, the monopsonist which can’t wage discriminate will: (i) Hire more labor at any specified wage. (ii) Hire less labor at any wage. (iii) Pay a higher wage for any specified quantity of labor. (iv) Hire more prolific l
The allocatively efficient price of a good by the vantage point of society is the price which equals the: (w) average social cost of producing this. (x) average variable cost of producing this. (y) total social cost of producing this. (z) marginal soc
Select the right answer of the question. A supply curve that is a vertical straight line indicates that: A) production costs for this product cannot be calculated. B) the relationship between price and quantity supplied is inverse. C) a change in price will have no ef
A) Use the table below to draw graphs that show the relationship between price elasticity of demand and total revenue. <
A monopolist which does not price discriminate faces a marginal revenue curve which slopes down quicker than its demand curve since: (w) economies of scale are significant. (x) selling more needs lowering the price of
I have a problem in economics on Labor Unions-Union membership. Please help me in the following question. The union membership is most widespread among: (1) White collar workers. (2) Managers and Supervisors. (3) Blue collar workers. (4) Young, upward
A particular monopolistically competitive firm’s total revenue is probably to increase when this: (w) increases the prices of its products and consumer demand is elastic. (x) maintains its original price even if all of its compe
18,76,764
1959478 Asked
3,689
Active Tutors
1430834
Questions Answered
Start Excelling in your courses, Ask an Expert and get answers for your homework and assignments!!