--%>

Elasticity of demand for labor between two points

The arc elasticity of Plastibristle’s demand for labor in between point c and point d is approximately: (1) 0.375. (3) 0.545. (4) 0.833. (4) 1.200 (5) 2.000.
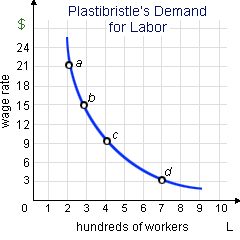
425_Elasticity of the Demand for Labor problem.png

I need a good answer on the topic of Economics problems. Please give me your suggestion for the same by using above options.

   Related Questions in Managerial Economics

  • Q : Labor and Revenue in Purely Competitive

    Short run total revenue of the purely competitive firm would be at a maximum along with: (1) 600 workers. (2) 700 workers. (3) 800 workers. (4) 900 workers (5) 1000 workers.

    Q : Define naive method and its techniques

    Define naive method and its techniques briefly.

  • Q : Huge parts of the enormous incomes

    Huge parts of the enormous incomes earned through some gifted athletes and performers are pure economic: (w) wages. (x) profits. (y) interest. (z) rents. Hello guys I want your advice. Please recom

  • Q : Illustrates the important leading

    Illustrates the important leading indices?

  • Q : Illustrates the term Elasticity

    Illustrates the term Elasticity?

  • Q : Human Capital Accumulation and the

    A society’s stock of human capital would be least probable to grow as a consequence of: (w) federal subsidies for college education. (x) sustained unemployment during a recession. (y) apprenticeship programs for construction workers. (z) retrain

  • Q : Wage rate by hiring labor by price taker

    A firm which is a price taker in the labor market will hire labor to the point where the wage rate is equals labor’s: (w) average output. (x) marginal revenue product. (y) average revenue product. (z) marginal physical product.<

  • Q : Attain new equilibrium in purely

    When this purely competitive labor market is primarily in equilibrium at D0L, S0L and after that excessive job safety standards are imposed through law, a new equilibrium will be attained at: (1) D0L, S0L. (

  • Q : Illustrates the criteria for good

    Illustrates the criteria for good forecasting method?

  • Q : Highest income of supply of labor This

    This worker’s weekly income in this demonstrated figure would be the highest at: (w) point a. (x) point b. (y) point c. (z) point d. How can I solve my Economics problem? Please suggest me the correct answer.