--%>

Effected income of a small changes

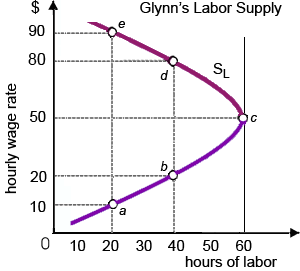
The income effect of a small change in wage rate in demonstrated figure of Glynn dominates the substitution effect at: (1) point a. (2) point b. (3) point c. (4) point d. (5) every point specified in the figure.

2104_Labor-Leisure Trade-offs.png

Can someone explain/help me with best solution about problem of Economics...

   Related Questions in Microeconomics

  • Q : Costs and Operating Decisions The firm

    The firm will stop the progress of it operations unless the firm’s owner(s) anticipate that future revenues will: (1) Produce an economic profit. (2) Cover the predicted totals of all future explicit and implicit costs. (3) Yield an accounting profit. (4) As wel

  • Q : Long run supply Illustrate and explain

    Illustrate and explain using diagrams, the difference between long run supply in a constant cost individual firm and industry and an increasing cost firm and industry.

  • Q : Price elasticity of demand at

    At prevailing prices, there the price elasticity of demand for that good would be lowest: (w) Coca Cola. (x) Generic soda. (y) Water. (z) Dasani bottled water. Hey friends please give your opinion for the problem o

  • Q : Produce output by zero marginal reveune

    When LoCalLoCarbo, the favorite corporation of fad dieters,in that case produces output q* [that where is marginal revenue is zero] as: (1) LoCalLoCarbo’s total revenue is at its highest possible level. (2) expanding output to q4 would cause tot

  • Q : Needs Standard for Income Distribution

    The needs standard for income distribution would certainly involve: (w) difficulty in the measurement of productivity. (x) an enormous bureaucracy. (y) greater incentives for production than the contribution standard. (z) economic ef

  • Q : Market period disequilibrium At the

    At the price P1, this purely competitive Christmas tree industry is within: (w) long-run equilibrium. (x) short-run equilibrium. (y) market period disequilibrium. (z) short-run disequilibrium.

    Q : Lorenz curve as graphical device A

    A Lorenz curve is graphical device which can be utilized to portray the: (w) number of people below the poverty level. (x) conflict between high tax rates and high tax revenues. (y) relative inequalities in the distribution of a variable across a popu

  • Q : Market experience increases in quantity

    When equilibrium moves from point a to point b, the merely market experiencing raise within quantity supplied is demonstrated into: (w) Panel A. (x) Panel B. (y) Panel C. (z) Panel D.

    Q : Substitution effect on supply curves

    One of the reasons for positive relationship among relative price and quantity supplied is the: (1) Technology effect, whereby bigger firms generate at lower average costs than the smaller firms. (2) Substitution effect, whereby firms switch among for

  • Q : Income elasticity and population growth

    For most families inside the United States, there the income elasticity of demand appears to be lowest, upon average, while looking the demand for: (1) better government. (2) environmental quality. (3) education. (4) children. (5) vac