--%>

Economic Rent of Demand Curve

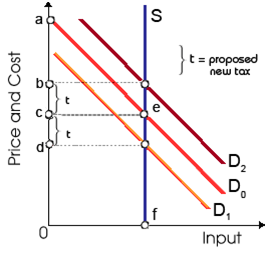
When D0 is the initial demand curve for land in this illustrated figure, within equilibrium the economic rent realized through the landowner will be: (1) zero. (2) area Ocef. (3) area cae. (4) area Oaef. (5) a pure economic profit.

377_Economic Rent Problems.png

Please guys help to solve this problem of Economics with some explanation.

   Related Questions in Microeconomics

  • Q : Type of model used by economists Which

    Which type of model is used by the economists to analyze competitive market?

  • Q : Changes in Household Demand The changes

    The changes in a household’s tastes most directly influence the families: (1) Number of members. (2) Demands for goods. (3) Total wealth. (4) Income constraint. Can someone please help me in finding out the a

  • Q : Describe price elasticity of demand

    Price elasticity of demand: The Price elasticity of demand refers to the degree of responsiveness of the quantity demanded to modifications in price. Ed = (ΔQ/Δ P) x (P/Q)

  • Q : Sign of Lorenz Curves The Lorenz curve

    The Lorenz curve gives an indication of: (w) the poverty rate. (x) dead end poverty. (y) relative poverty. (z) post-transfer poverty. Can someone explain/help me with best solution about problem of Economic

  • Q : Differences in site values An acre of

    An acre of Manhattan is worth additional than an acre of prime Iowa farm land due to differences in: (1) perpetuities. (2) time preferences. (3) site values. (4) interest rates. (5) taxes. Can someone explain/help me with best solu

  • Q : More elastic demand for labor The

    The demand for labor is more elastic the: (i) larger labor costs are like a proportion of total costs. (ii) shorter the time interval considered. (iii) greater the supply of labor. (iv) more difficult this is to substitute one resource for another. (v

  • Q : Human Capital-General Training The

    The knowledge regarding local trees and shrubs which Morgan learns as working as an apprentice landscaper in suburbs of a big city is an illustration of the advantages from: (i) Dirty work. (ii) Dues-paying. (iii) General training. (iv) High-skilled employment. (v) Sp

  • Q : Break-even level of income The

    The break-even level of income for four member of family under the negative income tax system demonstrated in this figure is: (1) $15,000 per year. (2) $30,000 per year. (3) $45,000 per year. (4) $60,000 per year. (5) $75,000 per year

  • Q : Illustrates average variable cost curve

    LoCalLoCarbo has become the favorite of fad dieters. There in curve E shows: (1) LoCalLoCarbo’s marginal cost curve. (2) LoCalLoCarbo’s average variable cost curve. (3) LoCalLoCarbo’s average total cost curve. (4) the market demand curve facing LoCal

  • Q : Upward-sloping in Law of Supply The law

    The law of supply is graphically exhibited by the supply curve which is: (1) Moving all along the demand curve. (2) Vertical. (3) Upward-sloping. (4) Downward-sloping. Can someone please help me in finding out the