--%>

Economic profits maximizing

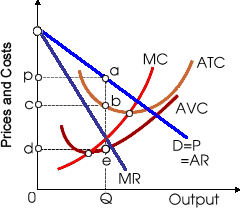
When this monopolistic competitor produces Q units, this is maximizing: (w) sales development and its market share. (x) total revenue. (y) economic profits. (z) total fixed cost and its managers' salaries.

2019_Monopolistic Competition.png

Can anybody suggest me the proper explanation for given problem regarding Economics generally?

   Related Questions in Microeconomics

  • Q : Equilibrium moves market reduce in

    When equilibrium moves from point a to point b, the simple market experiencing a reduce in supply is demonstrated within: (w) Panel A. (x) Panel B. (y) Panel C. (z) Panel D.

    Q : Total revenue in profit-maximizing

    Total revenue (i.e., TR=PQ) for such profit-maximizing competitive firm equals area as: (a) 0P1gq5. (b) 0P1dq4. (c) 0P2cq3. (d) P2

  • Q : Occurrence of equilibrium output of firm

    Economists frequently suppose that equilibrium output for any firm arises where: (w) revenue is maximized. (x) revenue is rising. (y) profit is rising. (z) profit is maximized. Can someone explain/help me with best

  • Q : Output and price comparison with

    Compared to the output and price which are allocatively efficient by the vantage point of society, in that case a monopolist tends to: (w) produce less and charge a higher price. (x) maximize average profits when possible. (y) set price in the inelast

  • Q : Purely competitive firm with no market

    A purely competitive firm along with no market power faces: (1) a perfectly elastic demand curve. (2) a perfectly elastic supply curve. (3) a perfectly inelastic demand curve. (4) a perfectly inelastic supply curve. (5) a downward sloping demand curve

  • Q : Market price below equilibrium price

    When the market price is beneath the equilibrium price then: (i) The market will clear. (ii) An excess exists. (iii) Consumers will not invest. (iv) The shortage exists. (v) Each and every consumer will be satisfied. Find out the r

  • Q : Explain Production Possibility curve

    Elucidate Production Possibility curve with the help of a diagram? Answer: The Production Possibility Curve refers to a curve that shows various production possibil

  • Q : Elasticity of supply when price hike

    When a $5 price hike raises the number of tanks of dehydrated water supplied in this market from point e to point f, the elasticity of supply: (i) 2.333. (ii) 2.000. (iii) 1.667. (iv) 1.333. (v) 0.600. How can I so

  • Q : Profit maximization-output level in

    Profit maximization needs a purely competitive firm to manufacture at an output level where: (i) marginal revenue > marginal cost. (ii) marginal cost equals the competitive price. (iii) marginal cost is falling. (iv) marginal reven

  • Q : Experience of mill for constant cost

    When generic lumber processing is a constant cost industry, within the long run this lumber mill is probable to experience a: (i) a severe shrinking of economic profit to zero. (ii) a decline within the price of 2×4s to about $2.40 apiece. (iii)