--%>

Earning price in Human capital

As per shown in this graph, the average high school graduate will earn around: (1) $12,000 yearly. (2) $20,000 yearly. (3) $45,000 yearly. (4) $90,000 yearly. (5) $100,000 yearly.

1528_Human Capital problem.png

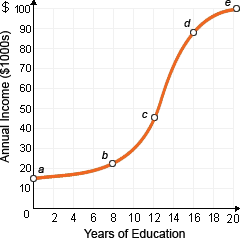
How can I solve my Economics problem? Please suggest me the correct answer.

   Related Questions in Managerial Economics

  • Q : Determine the demand of auto-market

    Suppose that the auto market began at the intersection of S0 and D0 before people began to expect auto prices to rise in the close to future. How will it influence the auto market?: (1) No change. (2) Demand shifts to D2. (3) Demand sh

  • Q : Equilibrium of the consumers of the two

    identify two goods consumed by the majority of the neighborhood communities. Qn. establish the equilibrium of the consumers of the two goods

  • Q : Causes of Business Cycle Illustrates

    Illustrates the causes of business cycle?

  • Q : Define the term full cost concept

    Define the term full cost concept.

  • Q : Problem of adverse selection Signaling

    Signaling may worsen the problem of adverse selection when: (w) potential agents do not transmit any types of signals. (x) job applicants increasingly signal with phony degrees. (y) employers discriminate on the basis of race or gender. (z) severe rec

  • Q : Wage rate paid for raises labor When

    When the wage rate paid for labor raises, in that case the: (1) supply of labor increases (2) opportunity cost of leisure rises. (3) workers always supply more labor. (4) level of national income increases. (5) opportunity cost of leisure falls.

  • Q : Value of the Marginal Product and

    When a firm is a price taker in the sale of its product, in that case labor’s: (w) ARP (Average Revenue Product) = MRP. (x) ARP = VMP. (y) VMP > MRP. (z) VMP = MRP. Can someone explain/help me with best so

  • Q : Negative Relationship in Demand for

    The demand curve for labor can be demonstrated as a negative relationship between: (w) the quantity of labor demanded and the wage rate. (x) labor productivity and the quantity of labor used. (y) employment and output. (z) wages and GDP.

  • Q : Profit price by earning in Human capital

    As per demonstrated in this graph, there average college graduate will earn around: (1) $12,000 yearly. (2) $20,000 yearly. (3) $45,000 yearly. (4) $90,000 yearly. (5) $100,000 yearly.

    Q : Explain the reasons for demand curve

    Explain the reasons for demand curve slopes downward.