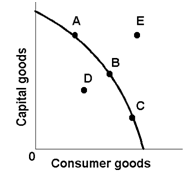
Refer to the following domestic production possibilities curve for Karalex. The gain to Karalex from specialization and international trade is represented by a move from: 1) A to B. 2) C to A. 3) C to D. 4) B to E.
Help me to get through this problem