--%>

Domestic opportunity cost of production possibilities tables

Hypothetical production possibilities tables for New Zealand and Spain are given below

639_Hypothetical production possibilities.png


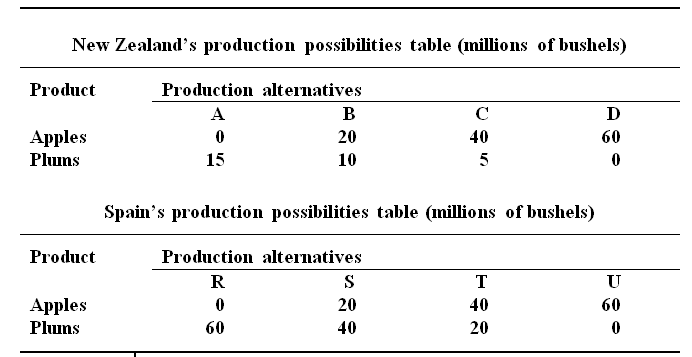
Employing a graph, draw the production possibilities data for each of the two countries. Referring to graphs, Find out:

(a) Each country's domestic opportunity cost of generating plums and apples.

(b) Which nation has to specialize in which product.

(c) The trading possibilities lines for each of the nation if the real terms of trade are 1 plum for 2 apples.

(d) Profit after trade.


E

Expert

Verified

(a) New Zealand’s cost ratio is 1 plum = 4 apples (or 1 apple = 1/4 plum). Spain’s cost ratio is 1 plum = 1 apple (or 1 apple = 1 plum). Illustrates in the below graphs.

(b) New Zealand has to specialize in apples, Spain in plums.

(c)  The trading possibilities lines for each of the nation if the real terms of trade are 1 plum for 2 apples is described in graph below

(d) Net production before specialization & trade: 40 apples (20 + 20) and 50 plums (10 + 40). After specialization & trade: 60 apples & 60 plums. Gain will be 20 apples and 10 plums.


467_Production possibilities data.png

   Related Questions in Finance Basics

  • Q : How are financial trades made on a

    How are financial trades made on a planned exchange?Each of exchange listed security is traded at a particulate location on the trading floor called the post. The trading is supervised through specialists who act either as brokers (bringing toge

  • Q : Define COBCP COBCP : Capital outlay

    COBCP: Capital outlay budgets are zero-based each and every year, thus, the department should submit a written capital outlay budget modify proposal for each fresh project or following phase of an existing project for which the department needs fundin

  • Q : Which ratios would long-term bond

    Which ratios would a potential long-term bond investor is most interested in? Describe. Current & potential lenders of long-term funds, such like banks & bondholders, are interested in debt ratios. While a business's debt ratios rise sig

  • Q : Better risk measure in evaluating risk

    Why is the coefficient of variation a better risk measure to employ than the standard deviation while evaluating the risk of capital budgeting projects? The coefficient of variation is a better risk measure than the standard deviation alone sinc

  • Q : Question on budget line On a Lotto

    On a Lotto Canada ticket A person won $15 at the local 7-Eleven & decided to spend all the winnings money on bags of peanuts and candy bars. The cost of candy bars= $.75 and the cost of peanuts = $1.50. a. In general, how woul

  • Q : Reimbursement Warrant or Revenue

    Reimbursement Warrant (or Revenue Anticipation Warrant): A warrant which has been sold by the State Controller’s Office, as an outcome of a cash shortage in th

  • Q : Describe relationship among a bonds

    Describe relationship among a bond's market price and its promised yield to maturity? Describe.A bond's market price based on its yield to maturity (YTM). While a bond has YTM greater than its coupon rate, it sells at discount from its face va

  • Q : Label equilibrium price P-equilibrium

    Normal 0 false false

  • Q : Describe significance of excess reserves

    Normal 0 false false

  • Q : Explain Fiscal Committees Fiscal

    Fiscal Committees: The committees of members in every house of the Legislature which review the fiscal impact of proposed legislation, comprising the Budget Bill. Presently, the fiscal committees comprise the Senate Budget and Fiscal