--%>

Determine total revenue when maximizes economic profits

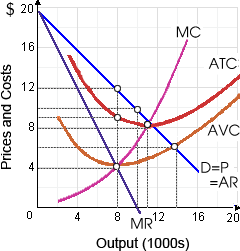
Total revenue when this firm maximizes economic profits would be: (w) $72,000 per period. (x) $80,000 per period. (y) $96,000 per period. (z) $100,000 per period.

392_Price Discrimination.png

Can anybody suggest me the proper explanation for given problem regarding Economics generally?

   Related Questions in Microeconomics

  • Q : Problem relating to Moral Hazard When

    When insurance companies pay back insured individuals for all the medical bills they submit: (1) Hypochondria will tend to be cured very rapidly. (2) People would tend to frequent the doctor's office more frequently. (3) An immoral choice problem would foster underuti

  • Q : Purely competitive model for analyzing

    The purely competitive model: (w) is characteristic of many actual U.S. market structures. (x) analyzes a type of economy which is now extinct. (y) is a helpful abstraction from actuality for analyzing firms’ behavior. (z) proves which modern ca

  • Q : More unit gains marginal revenue by

    A firm which can sell each and every unit of its production at a price of $200 and that sells 500 more units gains marginal revenue by the additional units of: (w) $500,000. (x) $100,000. (y) $200. (z) $10,000. I n

  • Q : Problem on enhanced interstate highways

    Can someone help me in finding out the right answer from the given options. In the year 1950 the federal government enhanced interstate highways, therefore decreasing the: (1) Demand for and the volume of highway travel. (2) Growth rate of city sprawl. (3) Demand for

  • Q : Oligopolistic markets in equilibrium

    Oligopolistic markets in equilibrium are described by: (w) a large number of sellers of homogeneous output. (x) monopolistic sellers dealing along with only some buyers. (y) a small number of sellers of close substitutes. (z) socially optimal amounts

  • Q : Expected Rate of Inflation What is the

    What is the Expected Rate of Inflation. Illustrate the term.

  • Q : Graphical relationship depicted by

    Demand curves graphically depict the relationships which are: (i) Positive among the demand for a good and its relative price. (ii) Negative between the quantity demanded and the opportunity cost of a good. (iii) Positive between income and expenditures. (iv) A horizo

  • Q : Affect of total utility to marginal

    Whenever total utility is at a maximum, then marginal utility is: (1) Rising. (2) Reducing. (3) Zero. (4) Similar as total utility. Can someone help me in getting through this problem.

  • Q : Trends in Income Distribution The year

    The year in that a long-run trend towards greater equality within the U.S. income distribution was reversed, therefore income since then has become less equally distributed, it was roughly: (w) 1945. (x) 1960. (y) 1975. (z) 1990.

    Q : Market structure in an automotive

    What type of a market structure in an automotive industry?