--%>

Determine total revenue by quantity and price graph

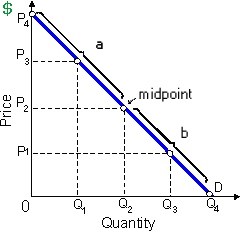
In this demonstrated figure, the total revenue: (w) varies inversely along with price in range b. (x) is minimized at the midpoint of the demand curve. (y) remains unchanged like price changes within range b. (z) will raise as price falls within range a.

1046_Total Revenue and Elasticity.png

How can I solve my Economics problem? Please suggest me the correct answer.

   Related Questions in Microeconomics

  • Q : Problem regarding market demand curve

    Hey friends I need your help for illustrated figure in below where for cranberries, the market demand curve is: (i) A. (ii) B. (iii) F. (iv) J. (v) E. 1579_</span></p>
                                        </div>
                                        <!-- /comment-box -->
                                    </li>
   
   </td>
	</tr><tr>
		<td>
       
      <li>
                                        <div class=

    Q : Determine free-market equilibrium price

    In the year of 1983, the Reagan Administration introduced a new agricultural program known as the Payment-in-Kind Program. To distinguish how the program worked, let's assume the wheat market. Assume the demand function is QD = 28 - 2P and the supp

  • Q : Program of Craft Unions The union based

    The union based just on workers with a specific skill, and which usually consists of apprenticeship programs which lead to ‘journeyman’ and then ‘master craftsman’ ratings is a/an: (1) Craft union. (2) Open union. (3) Company union. (4) Exclusi

  • Q : Product differentiation in market If

    If new soap operas that, although same to the previous ones, all are advertised as original and new, the TV networks are engaging within: (i) bait and switch. (ii) product differentiation. (iii) monopolistic competition. (iv) dynamic game theory. (v)

  • Q : Horizontal individual demand curves The

    The market demand curve is recognized by: (i) Vertically summing up individual demand curves. (ii) Graphing intersections of demand and supply over time. (iii) Holding quantity constant while summing up each price on demand curve. (iv) Horizontally summing up individu

  • Q : Unexpected inventory growth of price

    These supply and demand curves within the sugar market specify that: (w) a price floor of P0 for sugar will cause a surplus. (x) a price ceiling of P2 will cause a shortage. (y) the market clears while quantity equals Q0

  • Q : Demand for Labor-Monopsony Power When

    When wage discrimination is not probable for the first 40 workers this profit-maximizing organization hires, however it can wage discriminate perfectly whenever hiring all the subsequent workers, it hires a net of: (i) Forty workers at an average salary of $700 per we

  • Q : Purely competitive firms in increasing

    When purely competitive firms operate within increasing cost industries, several: (1) individual firms’ supply curves should be horizontal. (2) firms should experience decreasing returns to scale at low output levels. (3) specia

  • Q : Function of negative economic profits A

    A function of negative economic profits is to: (w) attract new firms into the industry. (x) keep competition within. (y) signal to other firms to invest their capital into this industry. (z) correct resource allocations by forcing firms generating los

  • Q : Profit maximization at the rate of

    At the rate of output, profits are maximized where marginal: (i) revenue is maximized. (ii) revenue equals marginal cost. (iii) revenue exceeds marginal cost by the greatest amount. (iv) cost is minimized. Can some