--%>

Determine total annual revenue

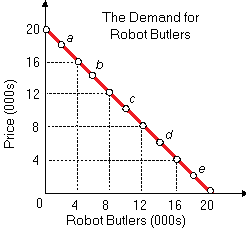
As per this illustrated figure as in below, the total annual revenue of Robot Butlers, Inc. will be greatest when this produces and sells as: (w) 5,000 Robot Butlers. (x) 10,000 Robot Butlers. (y) 15,000 Robot Butlers. (z) 20,000 Robot Butlers.

2426_Price Elasticity of Demand3.png

Hello guys I want your advice. Please recommend some views for above Economics problems.

   Related Questions in Microeconomics

  • Q : Increase revenues when price falls When

    When the price elasticity of demand for fried cheesy grits at Pixie’s Breakfast Grill is two, in that case a price cut of $2.80 to $2.00 per serving of grits would be most probably to: (1) reduce Pixie’s revenues from grits by roughly fort

  • Q : Explicit Costs of business The Explicit

    The Explicit costs of doing the business would comprise: (i) The value of owner’s time (ii) Depreciation on the company owned truck (iii) The interest that the owner could earn when her savings were not tied up in firm. (iv) Salaries paid to the

  • Q : Diminishing Marginal utility principle

    Can someone help me in finding out the right answer from the given options. The experience that your very first kiss with a latest crush was more thrilling and satisfying than your 10th kiss 35 minutes later is an illustration of the: (i) Familiarity principle. (ii) N

  • Q : Supply curve The short-run industry

    The short-run industry supply curve is found by what?

  • Q : Engage market power in price

    If this is possible, firms along with market power engage in price discrimination to: (i) defy civil rights legislation. (ii) help consumers. (iii) help the community. (iv) increase their profits. (v) reduce production costs.

  • Q : Income Distribution in Development

    Income distribution tends to turn into more equal, statistically, while a country: (i) adopts central planning. (ii) becomes more developed and prosperous. (iii) relies more heavily on agriculture. (iv) reduces corporate tax rates. (v) adopts laissez-

  • Q : Resource prices Refer to the following

    Refer to the following diagrams, in which AD1 and AS1 are the "before" curves and AD2 and AS2 are the "after" curves. Other things equal, a decrease in resource prices is depicted by:1) panel (A) only. 2) panel (B) only. 3)

  • Q : Problem on Supply Prices Can someone

    Can someone please help me in finding out the accurate answer from the following question. The relative monetary values organizations put on selling a bit more or less of a good are termed as: (i) Supply curves. (ii) Gain-maximizing prices. (3) Supply prices. (4) Pric

  • Q : Income distribution after taxes and

    When line 0C0' shows income distribution before taxes and transfers, in that case the line that shows income distribution after taxes and transfers would be: (1) line 0A0'. (2) line 0B0'. (3) line 0C0'. (4) line 0D0'. (5) line 0E0'.

    Q : Total revenue and total cost for firm

    Total revenue for the firm in illustrated figure is __________ __________ total cost.: (w) greater than (x) less than (y) equal to (z) Cannot be determined by the information given.

    Discover Q & A

    Leading Solution Library
    Avail More Than 1414753 Solved problems, classrooms assignments, textbook's solutions, for quick Downloads
    No hassle, Instant Access
    Start Discovering

    18,76,764

    1952652
    Asked

    3,689

    Active Tutors

    1414753

    Questions
    Answered

    Start Excelling in your courses, Ask an Expert and get answers for your homework and assignments!!

    Submit Assignment

    ©TutorsGlobe All rights reserved 2022-2023.