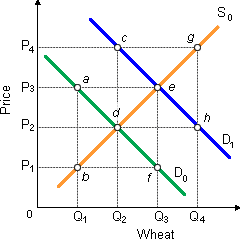
When the U.S. wheat market as in below demonstrated graph is primarily within equilibrium on S0D0, in that case the yearly total revenues (price × quantity) of wheat farmers will equivalent: (1) 0P4gQ4. (2) 0P3eQ3. (3) 0P2dQ2. (4) 0P1bQ1. (5) 0P3aQ1.
How can I solve my economics problem? Please suggest me the correct answer.