--%>

Determine the demand of auto-market

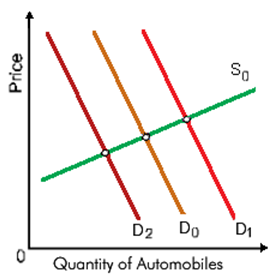
Suppose that the auto market began at the intersection of S0 and D0 before people began to expect auto prices to rise in the close to future. How will it influence the auto market?: (1) No change. (2) Demand shifts to D2. (3) Demand shifts to D1. (4) Supply falls along D0. (5) Supply rises along D0.

2142_quality of automobiles.png

Hello guys I want your advice. Please recommend some views for above economics problems.

   Related Questions in Managerial Economics

  • Q : Demand demand has three

    demand has three essentials-damand+purchasing power+.???

  • Q : Formulate the Cross Elasticity of demand

    Formulate the Cross Elasticity of demand?

  • Q : Occurrence of Occupational Crowding An

    An illustration of occupational crowding occurs while: (1) Morgan, Blake and Jackie share one small office and a fax machine at an investment firm. (2) Juanita, Rosa, and Maria find work only as hotel maids since, as Hispanic women, they are stereotyp

  • Q : What is Oligopoly What is Oligopoly?

    What is Oligopoly? Explain in brief.

  • Q : Total Labor Income by Elasticity of

    When the demand for labor is wage elastic, raises in wage rates cause total labor income to: (w) increase. (x) decrease. (y) remain the same. (z) fluctuate erratically. I need a go

  • Q : Difference between economics and

    What is the difference between economics and managerial Economic?

  • Q : States the term fixed cost in briefly

    States the term fixed cost in briefly.

  • Q : Income effect of a wage increasing When

    When the income effect of a wage increase is more powerful in that case the substitution effect, the: (1) labor supply curve will be “backward bending.” (2) unemployment rate will rise since more people will be available for work. (3) valu

  • Q : Backward Bending Labor Supplies The

    The graph for the supply of labor might be backward bending since: (w) the substitution effect surpasses the income effect at specific wages. (x) overtime workers receive pay for time and a half. (y) the substitution effect. (z) the income effect is m

  • Q : Average rate of return in Human Capital

    This illustrated graph indicates that, there on average, rate of return to education is greatest for finishing the previous year of: (1) kindergarten, at point a. (2) grade school, at point b. (3) high school, at point c. (4) undergraduate college, at