--%>

Determine most price elastic in curve

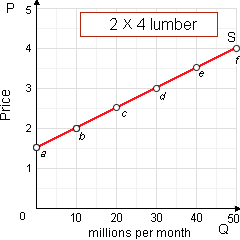
The part of this supply curve for 2×4s which is most price elastic is in between: (i) point a and point b. (ii) point b and point c. (iii) point c and point d. (iv) point d and point e. (v) point e and point f.

385_Price Elasticity of Supply2.png

I need a good answer on the topic of Economics problems. Please give me your suggestion for the same by using above options.

   Related Questions in Microeconomics

  • Q : Earning income under negative income tax

    Under the negative income tax system demonstrated in this figure, a family of four along with earned income of $15,000 yearly would have a net [after-tax] income of: (i) $30,000 per year. (ii) $27,500 per year. (iii) $25,000 per year.

  • Q : Problem relating to supply curve Can

    Can someone help me in finding out the right answer from the given options. The supply curve reveals the highest: (i) Stock on hand in inventory. (ii) Gains a firm makes by selling varying quantity of a good. (iii) Quantity of a good which sellers will offer at differ

  • Q : Total revenue of monopolistically

    A particular monopolistically competitive firm’s total revenue is probably to increase when this: (w) increases the prices of its products and consumer demand is elastic. (x) maintains its original price even if all of its compe

  • Q : Quantity demands equivalent quantity

    These supply and demand curves for sugar propose that the: (1) demand price exceeds the supply price at quantity Q2. (2) technology should advance to allow output to develop to Q4. (3) quantity demanded equals quantity supplied at P1.

  • Q : Scope of spiral and waterfall approach

    Explain the difference in changing the scope between a spiral approach and a waterfall approach?

  • Q : Emerging by price discrimination

    Oligopolies are least expected to emerge due to: (1) economies of scale. (2) price discrimination. (3) strategic barriers to entry. (4) mergers. (5) legal barriers to entry. Can anybody suggest me the proper explan

  • Q : Downward-sloping demand curve The law

    The law of demand is graphically demonstrated by: (1) Movement all along the supply curve. (2) The downward-sloping demand curve. (3) The rightward shift of demand curve. (4) Shifting of production possibilities. C

  • Q : Problem on relative monetary values The

    The relative monetary values an individual consumer subjectively puts on containing a bit more or less of a good are termed as: (i) Consumer preferences. (ii) Demand prices. (iii) Psychic prices. (iv) Subliminal prices. (v) Consumer utilities.

  • Q : Price of Bond by Perpetuity When all

    When all bonds are perpetuities which annually pay $100, at an interest rate of 2%, in that case the price of these bonds would be: (1) $9800. (2) $5000. (3) $980. (4) $800. (5) $1,020. How can I s

  • Q : Market structure of oligopoly firm

    Assume that a firm is conscious which rival firms will adjust to counter any changes in the firm’s policies and accordingly, the firm behaves strategically while this sets prices, terms to customers or output levels. That a firm is operating in a market