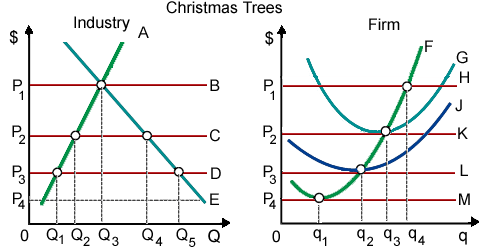
The market demand curve as in demonstrated figure for Christmas trees is: (i) curve A. (ii) curve E. (iii) curve F. (iv) curve G. (v) curve J.
I need a good answer on the topic of Economics problems. Please give me your suggestion for the same by using above options.