--%>

Determine loss in curve of profit or loss on graph of cost

As is given figure below. Assume that the prevailing price is P1 and the firm is now producing its loss-minimizing quantity. Determine the area which shows the loss: w) P2deP1. x) P3cbP1. y) P3caP0. z) 0P1bQ1.


2240_Illustrating Profit or Loss on the Cost Curve Graph.png

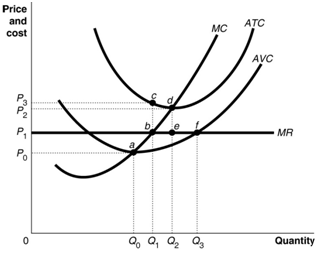
Choose one answer from above given options.

   Related Questions in Managerial Economics

  • Q : Relation between Average Revenue

    Illustrates the relation between Average Revenue, Total Revenue and Marginal Revenue?

  • Q : What are the types of price

    What are the types of price discrimination?

  • Q : Determine what would contain in

    Please help me to solve the problem of economic that is given below: Economic capital would comprise: (w) corporate bonds. (x) money. (y) machinery. (z) sports cars. Can someone

  • Q : Income effect of a change in wage rates

    When comparing such labor supplies in this illustrated figure, this is clear that the income effect of a change within wage rates is: (w) positive for Morgan and negative for Chandra. (x) more powerful than the substi

  • Q : Managerial Economics according to

    Illustrates the managerial Economics according to Spencer and Siegleman?

  • Q : Unitarily inelastic supply of labor

    Glynn’s supply of labor is unitarily inelastic while the wage rate increases by: (1) $10 per hour to $20 per hour. (2) $10 per hour to $50 per hour. (3) $20 per hour to $50 per hour. (4) $20 per hour to $80 per hour. (5) $80 per hour to $90 per

  • Q : Substitution Consequence on Labor Supply

    The substitution consequence on labor supply decision of an individual is more powerful than the income effect while: (1) higher wage rates result within increased hours worked. (2) cuts in wage rates yield discouraged worker effects. (3) the supply c

  • Q : Explain the business decision based

    Explain the business decision based upon income elasticity.

  • Q : Negatively bending Labor Supplies An

    An individual’s labor supply curve is negatively sloped that is backward-bending into a range of wages while the: (i) demand for goods exceeds the demand for leisure. (ii) worker offers more hours of labor while the wage rate in

  • Q : Illustrates the important areas of

    Illustrates the important areas of managerial economics as a tool for decision making?