--%>

Determine least price elasticity in market

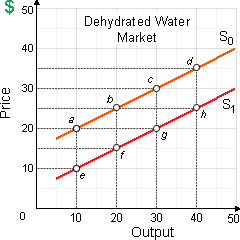
Of all of the known ranges on such supply curves, the supply of tanks of dehydrated water is least price elastic in between: (i) point a and point b. (ii) point b and point c. (iii) point c and point d. (iv) point e and point f. (v) point g and point h.

1011_Price Elasticity of Supply.png

Please choose the right answer from above...I want your suggestion for the same.

   Related Questions in Microeconomics

  • Q : Absolute and relative price is the

    is the price in the law of demand an absolute price or a relative price

  • Q : Profit-maximizing to make economic

    This profit-maximizing brickyard of below illustrated figure on the average is, about: (i) making an economic profit of $8 per thousand bricks. (ii) incurring variable costs of $90 per thousand bricks. (iii) suffering an accounting loss of $2 per thou

  • Q : Problem Bilateral Monopoly The word

    The word economists employ to explain a condition where a powerful seller confronts the powerful buyer is: (1) Reciprocal exploitation. (2) Strategic bloc management. (3) Dialectical bargaining. (4) Ancillary reciprocity. (5) Bilateral monopoly.

    Q : Biography-Thorstein Veblen The thought

    The thought that the desire of people to purchase goods is culturally recognized as opposed to the price determined is the vision of: (i) Irving Fisher. (ii) Karl Marx. (iii) Thorstein Veblen. (iv) Ludwig von Mises. (v) Antoine Augustin.

    Q : Competition and Rivalry When new firms

    When new firms enter an imperfectly competitive market, in that case the demand curves of the firms previously in the market will: (w) shift to the left. (x) shift to the right. (y) become vertical. (z) become horizontal.

    Q : Sum of Monopolistic Exploitation Sum of

    Sum of the monopolistic exploitation across all workers tends to rise however a firm as well functions at a more socially and economically proficient level of output and employment whenever the firm is capable to engage in: (1) Blacklisting in its dea

  • Q : Graphical relationship depicted by

    Demand curves graphically depict the relationships which are: (i) Positive among the demand for a good and its relative price. (ii) Negative between the quantity demanded and the opportunity cost of a good. (iii) Positive between income and expenditures. (iv) A horizo

  • Q : Define regressive in taxes as

    Line T2 depicts as in below graph a tax system which is: (i) progressive. (ii) recessive. (iii) proportional. (iv) biased. (v) regressive.

    Q : Perfectly price elastic demand For

    For Cournot’s Spring Water the demand is perfectly price elastic at:  (i) point a. (ii) point b. (iii) point c (iv) point d. (v) point e.

    Q : Labor Contracts of Check-off Provisions

    When a collective bargaining contract comprises a ‘check-off provision’: (1) Union workers can be fired when they don’t meet the production quotas. (2) Firms gather the union dues through deducting them from the paychecks. (3) Workers are needed to d