--%>

Determine least price elastic points

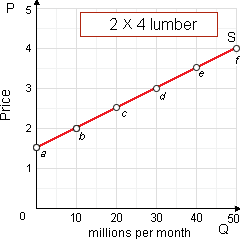
The section of this supply curve for 2×4s which is least price elastic is in between: (i) point a and point b. (ii) point b and point c. (iii) point c and point d. (iv) point d and point e. (v) point e and point f.

366_Price Elasticity of Supply2.png

Hey friends please give your opinion for the problem of Economics that is given above.

   Related Questions in Microeconomics

  • Q : Blacklisting-Labor history Can someone

    Can someone please help me in finding out the accurate answer from the following question. Firms which colluded by circulating the names of the union organizers and hence they would have difficulty getting jobs were engaged in a now-illegal practice termed as: (1) Fea

  • Q : Estimate income elasticity of demand

    When Y = income, that is the income elasticity of demand is approximately measured when the value of: (i) (% change in Q) / (% change in Y). (ii) ratio of the slopes of demand relative to supply. (iii) (% change in Q) / (% change in P). (iv) constant

  • Q : Annuity of the Perpetuity Dividing the

    Dividing the annuity of the perpetuity by the interest rate gives in the perpetuity’s: (w) rate of return. (x) present value. (y) internal rate of discount. (z) capitalization rate. Can someo

  • Q : Maximizes profits or minimizes losses

    When it is feasible for total revenue to exceed variable costs, in that case a monopolist which does not price discriminate maximizes profits or minimizes losses from producing the output where marginal revenu

  • Q : Pretax -posttax and transfer

    Refer to the following diagram. If line b represents the pretax and transfer distribution of income in the United States, we would expect the post-tax and transfer distribution to be: A) line a. B) line b, because taxes and transfers have no effect on income distribut

  • Q : Determine average production cost by an

    When Robomatic Corporation maximizes profit in its production of RoboMaids, its average production cost per robot will be roughly: (1) $3,000 per robot. (2) $5,000 per robot. (3) $7,000 per robot. (4) $9,000 per robot. (5) $11,000 per robot.

  • Q : Restricting output below competitive

    Below the competitive equilibrium output, restricting output will: (w) raise price above the competitive equilibrium price. (x) raise price above the marginal cost of the last unit produced. (y) generate a deadweight efficiency loss from underproducti

  • Q : Sticky prices in oligopoly markets

    Sticky prices within oligopoly markets are: (w) predicted by the kinked demand curve model. (x) substantiated by many statistical studies. (y) most common for highly differentiated products. (z) a result of price discrimination.

    Q : Horizontal summation of individual

    The purely competitive industry’s demand for the labor is: (i) Less elastic than the horizontal summation of individual firm’s demands. (ii) Perfectly elastic. (iii) Upward sloping as of the diminishing marginal returns to labor. (iv) Equi

  • Q : Nonexistent market supply and power

    HoloIMAGine has patented a holographic technology which creates 3-D photography obtainable to consumers. There is a market supply curve for HoloIMAGine technology: (w) nonexistent since price-maker firms simultaneously set prices as well as quantities