This given figure as in below demonstrates how the consumption of goods A, B, C and D differs as a family’s income changes. There income elasticity of demand equivalents 1 for: (w) good A. (x) good B (y) good C. (z) good D.
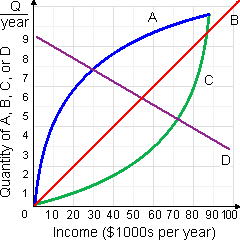
Please choose the right answer from above...I want your suggestion for the same.