--%>

Determine equilibrium at changing price

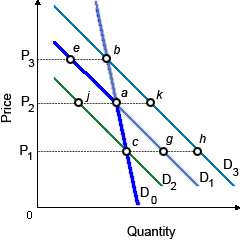
Within this kinked demand curve model, when this firm operated at point a and increased its price from P2 to P3 but other firms did not increase their prices, in that cases equilibrium for this firm would move to be: (w) point b. (x) point e. (y) point g. (z) point k.

1945_Kinked Demand Curves.png

Can someone explain/help me with best solution about problem of Economics...

   Related Questions in Microeconomics

  • Q : Economic Rent of Demand Curve When D 0

    When D0 is the initial demand curve for land in this illustrated figure, within equilibrium the economic rent realized through the landowner will be: (1) zero. (2) area Ocef. (3) area cae. (4) area Oaef. (5) a pure economic

  • Q : Economic minimized losses or maximized

    When a firm’s total revenue potentially exceeds total variable cost for at least one output level, in that case economic losses are minimized or profit is maximized through producing where: (i) average total cos

  • Q : Compute price elasticity At price of

    At price of Rs. 20 the unit quantity demanded is 300 units. Its price downs by 10% its quantity demanded rises by 60 units. Compute price elasticity. Answer: <

  • Q : Labor Productivity The American workers

    The American workers tend to be much productive than their counterparts in the South America or Asia in part as they have: (i) Superior natural genetic endowments. (ii) Access to the better sports programming, that promotes the team-work. (iii) More capital to work wi

  • Q : Prices of resources in constant cost

    When industry expansion or contraction does not influence the prices of resources used through its firms, then the industry tends to experience: (w) increasing costs. (x) constant costs. (y) decreasing costs. (z) diseconomies of scale.

    Q : Problem on Decisions at the Marginal

    The least clear illustration of how decisions are generally at the margin would be: (i) A floral shop hiring an additional clerk and opening earlier in hopes of increasing revenues by half. (ii) Eating less whenever the menu is a-la-carte than at an ‘all-you-can

  • Q : Purely competition on the average This

    This purely competitive brickyard as in below graph on the average experiences an: (w) economic profit of about $135 per day. (x) economic loss of roughly $150 per day. (y) accounting profit of less than $100 per day. (z) accounting loss of more than

  • Q : Illustration of Economic Capital An

    An illustration of economic capital would be: (1) loanable funds in banks. (2) factory buildings. (3) gold held through price speculators. (4) labor’s productive skills. (5) corporate stocks. How can I solve

  • Q : Question on Demand-Supply curves Assume

    Assume that the market for cigarettes in a specific town has the given supply and demand curves: QS = P; QD = 50 − P, here the quantities are evaluated in thousands of units. Assume that the town council requires raising $300,000 in revenue

  • Q : Illustration of Shirking Can someone

    Can someone please help me in finding out the accurate answer from the following question. Jones, a computer programmer, plays computer games all day rather than doing his work. This is an illustration of: (i) Moral turpitude. (ii) Inefficiency salaries. (iii) Shirkin