--%>

Determine average production cost by an example

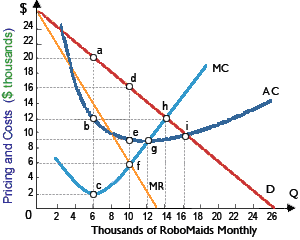
When Robomatic Corporation maximizes profit in its production of RoboMaids, its average production cost per robot will be roughly: (1) $3,000 per robot. (2) $5,000 per robot. (3) $7,000 per robot. (4) $9,000 per robot. (5) $11,000 per robot.

1002_Elasticity and profit.png

Hello guys I want your advice. Please recommend some views for above Economics problems.

   Related Questions in Microeconomics

  • Q : Relative price of the good The demand

    The demand curve depicts a negative relationship among price and quantity demanded since the quantity demanded rises if there is a decline in the: (1) Size of the family. (2) Incomes of the consumer. (3) Relative price of good. (4) Price of the substitute good. <

  • Q : Problem on Closed Shops Can someone

    Can someone please help me in finding out the accurate answer from the following question. The firm which operates beneath a closed shop agreement: (i) Produces more gains than the firm beset through union strikes. (ii) Is less beneath organized labor's control than t

  • Q : Effects of Globalization On Indian

    On Indian industry what are the effects of globalization?

  • Q : Average Product and Marginal Product

    State the relationship among Average Product and Marginal Product? A) If MP > AP, then AP is rising B) If MP = AP, then AP is maximum C) If MP < AP, then AP is falling

  • Q : Exceed elasticity of demand When the

    When the price of a good increase slightly, then total revenue: (w) falls in the inelastic range of the demand curve. (x) rises over the elastic range of the demand curve. (y) stays close to zero in the unitary-elastic range of the de

  • Q : Potential inefficiencies and inequities

    Whenever someone paying for the service can’t completely monitor the behavior or aims of the person offering the service, there are potential inequities and inefficiencies caused by the: (1) Moral hazard. (2) Adverse selection. (3) Utilitarianism. (4) Principal-

  • Q : Income distribution after taxes and

    When line 0C0' shows income distribution before taxes and transfers, in that case the line that shows income distribution after taxes and transfers would be: (1) line 0A0'. (2) line 0B0'. (3) line 0C0'. (4) line 0D0'. (5) line 0E0'.

    Q : Illustration of predatory behavior An

    An illustration of predatory behavior would be a firm: (w) building excess capacity to deter entry. (x) lowering price because of production cost decreases. (y) adopting a cost reducing technological innovation. (z) lowering prices to remove excessive

  • Q : Characteristics of purely competitive

    Characteristics of purely competitive markets do not comprise: (w) homogeneous products. (x) large numbers of potential buyers. (y) large numbers of potential sellers. (z) the capability of sellers to set prices. I

  • Q : Price elasticity of demand for pizza

    Since the price drops/falls from $8 to 1 all along this demand curve, the price elasticity of demand for pizza: (1) increases towards infinity. (2) Drops/Falls towards zero. (3) Increases, then drop/falls. (4) Always equivalents 1 and demand is unitar