--%>

Describe the Hirfindahl-Hirschman Index

Describe the Hirfindahl-Hirschman Index?
The Hirfindahl-Hirschman Index, or HHI, is the standard measure employed by economists to evaluate market concentration. The greater the level of concentration amongst competitors, the higher the HHI. The HHI runs on a scale from zero (representing extreme competitiveness) to 10,000 (demonstrating monopoly). The HHI is determined by squaring (multiplying by itself) the market share of every firm in a market, and then adding up the results.

                                        Example Calculation for a Hypothetical Market With HHI of 2,000    

448_Hirfindahl-Hirschman Index Source.png

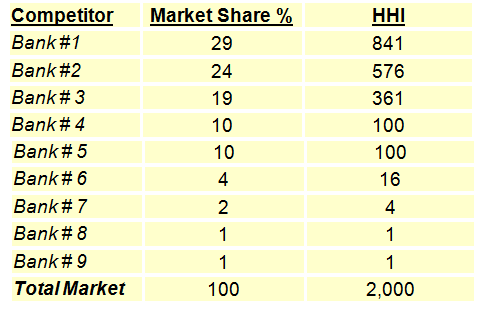
                                               (Hirfindahl-Hirschman Index Source: Federal Reserve)

   Related Questions in Finance Basics

  • Q : Describe benefits of the JIT inventory

    Describe the benefits of the JIT inventory control system? The just-in-time (JIT) inventory control system lowers inventory carrying costs & tends to raise quality.  

  • Q : Formula for the payment required for a

    Normal 0 false false

  • Q : Purchasing power parity of US and

    Under what condition would the U.S. dollar and the Canadian dollar said to be have achieved purchasing power parity? The U.S. dollar and the Canadian dollar would be assumed to have achieved purchasing power parity while the exchange rate reflec

  • Q : Describe depreciation expense Describe

    Describe depreciation expense as it seems on the income statement.  Accounting depreciation is the allocation of asset's primary cost over time. Depreciation cost on an income statement is the amount of the asset=s initial cost allocated to

  • Q : What are Authorized Positions

    Authorized Positions: As replicated in the Governor’s Budget (Expenditures by Category and modifications in Authorized Positions), corresponds with the “Total, Authorized Positions” illustrated in the Wages and Salaries.

  • Q : What is Final Budget Final Budget :

    Final Budget: Usually refers to the Governor’s Budget as amended by actions taken on the Budget Bill (example, legislative changes, and Governor’s vetoes). Note

  • Q : Production possibilities curve based

    Given is a production possibilities table for consumer goods (automobiles) and capital goods (forklifts): Illustrates these data graphica

  • Q : Alternative combinations of the two

    Assume you won $15 on a Lotto Canada ticket at the local 7-Eleven & decided to spend all the winnings on bags of peanuts and candy bars. The cost of candy bars is $.75 and the cost of peanuts is $1.50. Build a table illustrating the alternative combinatio

  • Q : Describe NAFTA Normal 0 false false

    Normal 0 false false

  • Q : Depict the slope of the line Normal 0

    Normal 0 false false