The pressure-temperature relation for solid-vapor or liquid vapor equilibrium is expressed by the Clausis-Clapeyron equation.
We now obtain an expression for the pressure-temperature dependence of the state of equilibrium between two phases. To be specific, we deal with the liquid vapor equilibrium.
The free energy of 1 mol of liquid is equal to the free energy of 1 mol of the vapor that is in equilibrium with the liquid. With subscript l denoting liquid and v denoting vapor, we can write
Gl - Gv (1)
And for an infinitesimal change in the system for which equilibrium is maintained, the differential equation
dGl = dGv can be written. (2)
Since only one component is present and the composition is not variable, changes in the molar free energy of the liquid or the vapor can be expressed by the total differential
dG = (∂G/∂P)T dP + (∂G/∂T)P dT (3)
The partial derivatives are related to the molar volume and entropy and thus, by eq. we can write for a molar amount in each phase
dG = V dP - S dT
Recognizing that although various temperatures and pressures can be considered and both phases are at the same temperature and pressure, we can apply this equation to the liquid and to the equilibrium vapor to give
Vl dP - Sl dT = Vv dP - Sv dT
Or
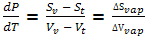
More generally
dP/dT = ΔS/ΔV where ΔS and ΔV signify changes from the two phases being considered.
We thus have an expression for the slope of the phase equilibrium lines on P-versus-T diagram.
The large value of ΔV for solid-vapor or liquid-vapor phases is related to small values of dP/dTand thus flatter curves on P-versus-T diagram than for solid liquid phases. Also, all curves tend to have positive slopes because the molar entropies and volumes both follow the same vapor greater than liquid and liquid greater than solid. The most notable exception is that for ice-liquid water, where ΔS and ΔV have opposite signs.
Example: the freezing point of eater at 1-bar, or 1-atm, pressure is 0°C, at this temperature the density of liquid water is 1.000 g mL-1, and that of ice is 0.917 g mL-1. The increase in enthalpy for the melting at this temperature is 6010 J mol-1. Estimate the freezing point at a pressure of 1000 bar.
Solution: consider the process
H2O(s)  H2O(l)
From the given data
ΔH = 6010 J mol-1

= 18.02 mL - 19.65 mL = -1.63 mL = -1.63 × 10⁻⁶ m3
The relation dP/dT = ΔS/ ΔV, with ΔS = ΔH/T and inverted for the interpretation we use here, becomes
dT/dP = T ΔV/ΔH
The melting point of ice is found to change little even with a large pressure change. If T is treated as a constant, and constant values for ΔV and ΔH are assumed, we obtained
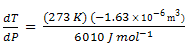
= 0.0074 K bar-1
The melting point at 1000 bar is lower than that at 1 bar by 7.4 K = 7.4°C. if we recognize thatT, in dT/dP = T ΔV/ ΔH, is a variable, but we still treat ΔV and ΔH as constants, integration fromT1 to T2 as the pressure changes from P1 to P2 gives

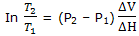
With T1 = 273 K and P1 = 1 bar, calculation of T2 for P2 = 1000 bar = 108 Pa now gives

= 273e-0.0271 = 273(0.973)
= 265.7 K = -7.3°C.